Agro API – service for agriculture

Agro API – service for agriculture

The OpenWeather team are pleased to announce that we are launching a new product aimed primarily at specialists developing agricultural services and addressing the specific requirements of this sector. This product is also geared toward the insurance and banking sectors and can be used as a farm rating tool.

VANE platform: The Polygon tool

VANE platform: The Polygon tool

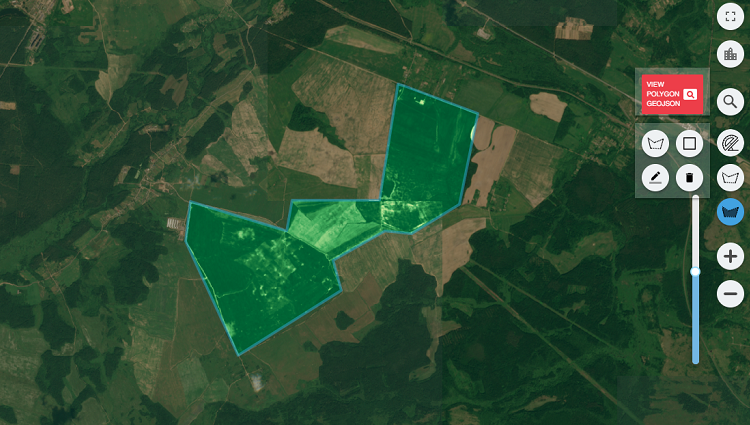
An example of one of the services for agricultural applications offered by VANE has now been added to the Query Builder interface.

The Polygon tool allows you to isolate any outline you want in the photograph, process the satellite images in RGB and EVI, and arrange any colour palette with any scale for a specific area.

It is possible to edit it, obtain data on the depicted polygon and download it from the GeoJSON file.

You can then get the URL with the assembled polygon and copy it to your site.

VANE platform news

VANE platform news

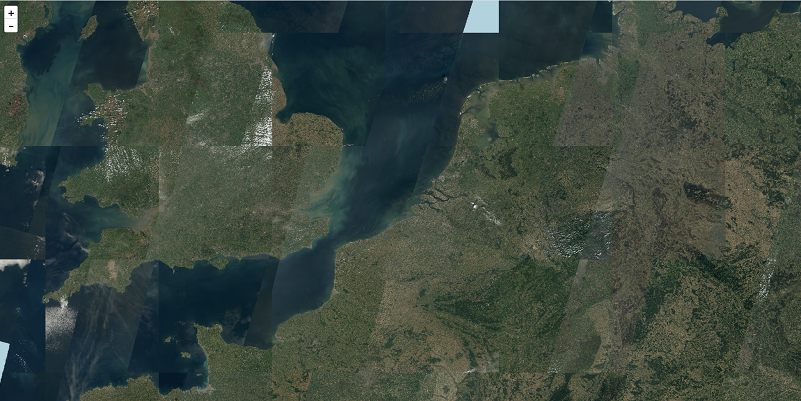
The filter algorithm for selecting BEST coverage tiles has changed.

BEST is the method for overlaying images (parameter value order), and is the best way possible, depending on the parameters selected: date range, satellite, percentage cloud cover.

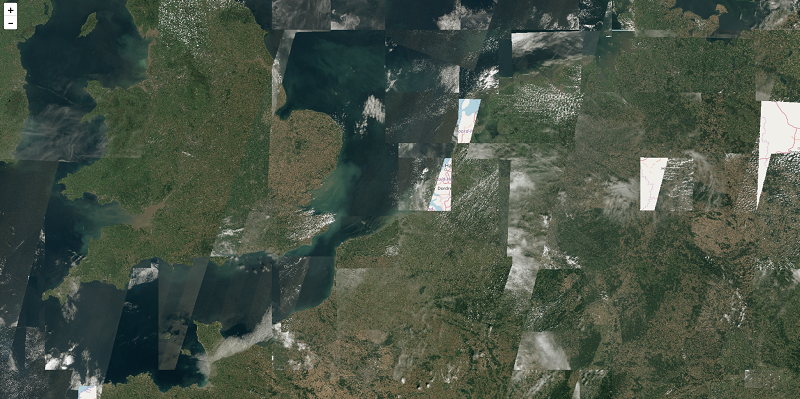
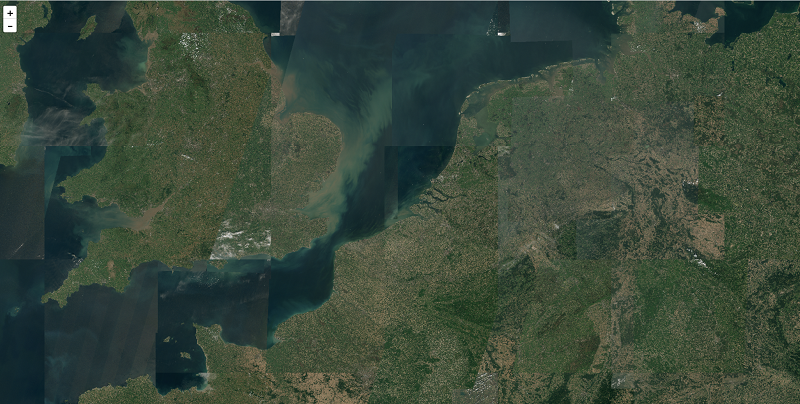
Changes to the algorithm have enabled the quality of coverage to be significantly enhanced:

Sentinel-2 - before

Sentinel-2 - after

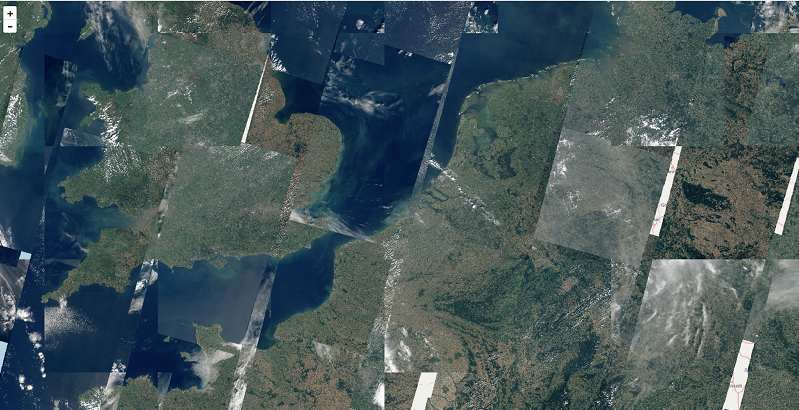
– combined data sources Landsat 8 and Landsat 8 TOA.


Landsat 8

Landsat 8 + Landsat 8_TOA

OpenWeatherMap 2017: Results of the Year

OpenWeatherMap 2017: Results of the Year

So the, new year, 2018, has come, and it’s time to sum up the results of the past year for our company, OpenWeatherMap (UK, US and Latvia), developers of one of the best weather APIs in the world. A lot has happened and much has changed.

During the year, our number of users grew from 600,000 to 1 million. We participated in the Startup Grind Global Conference in Silicon Valley, where the team from OpenWeatherMap was named in the top 50 Startup Exhibitions of 2017. Our mature team was filled up with excellent professionals and wonderful people.

We did a lot of new things and qualitatively improved our current developments. In 2017, we were pleased to present to you:

Weather data: API and Weather Maps

  • The Open Dashboard for Agricultural Monitoring can help give you an idea of the possible use for meteorological and satellite data in your agricultural applications.
  • Specially for the agriculture sector, we launched an API for accumulated temperature data and another for accumulated precipitation data.
  • The Weather Historical Bulk service. Now you can simply choose a city/town (or several cities/towns) and download an archive, which contains a bulk file with the weather history for up to 5 years – any day or week, or even several years.
  • A new and improved version of an API for UV-index.
  • Throughout the entire year, we worked constantly on our history weather API. During the year, the amount of data supplied and the speed of processing that data increased significantly. Also, we made it possible to quickly upload data in a format that doesn’t require additional processing and can be understood by any user.
  • Our Weather Maps app changed qualitatively in 2017. We added the ability to switch the layers of weather and satellite maps, create various combinations with them, and connect them to mobile and web apps.

Satellite data: VANE platform

In 2017, we significantly improved our satellite platform. Our team undertook a huge amount of work and in June were able to present a new version of the satellite image processing platform VANE.

Based on the VANE platform, we developed a new product called Global Satellite Base Map, which uses visual tools and query language to generate a map from satellite images. The uniqueness of the product is that all data processing is done on the fly, and there are no presets or pre-made calculations. The user defines the parameters for a calculation and image processing and immediately receives a result for any territory. This capability was only possible thanks to VANE, our super-powerful data processing platform.

We recently presented you with Query Builder, our new interface for the VANE platform. Now you can use this simple tool to create your own map in just a few seconds, and with just one click receive a completed link for display on your site or app using a web map library like Leaflet, Open Layer, Mapbox and Google Maps.

We are grateful to everyone that worked with us for all this time. We thank you for all your feedback and for not getting bored by our tech support.

We have a ton of plans for the coming year. Stay tuned, and you will see a lot of the new and interesting things to come. Subscribe to our Telegram Channel https://t.me/openweathermap and get news first about our updates and new products!
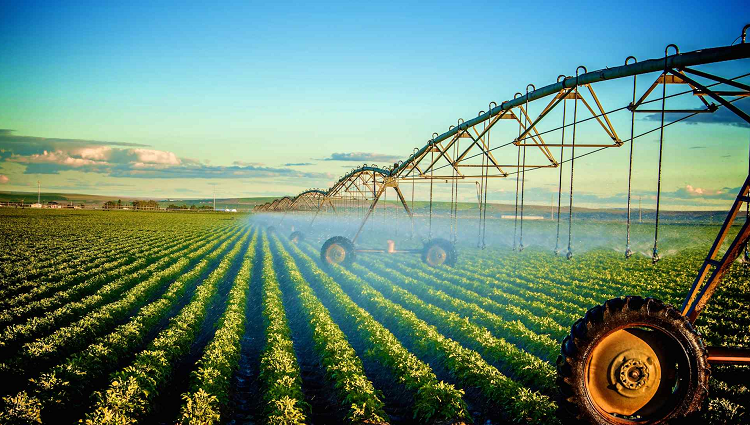
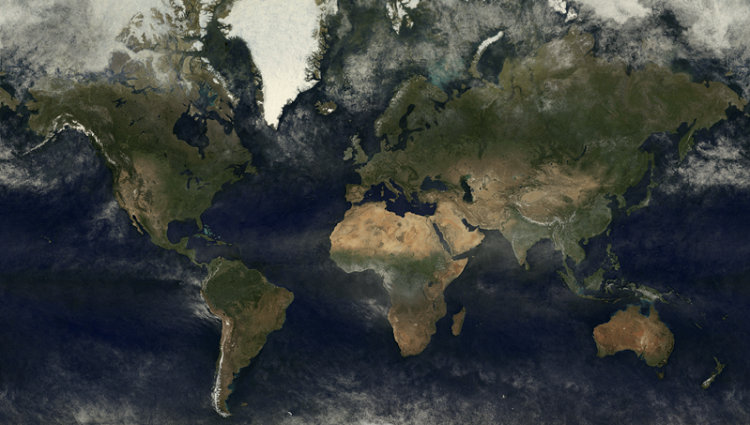
Cloudless: global cloudless composite coverage based on the VANE platform

Cloudless: global cloudless composite coverage based on the VANE platform

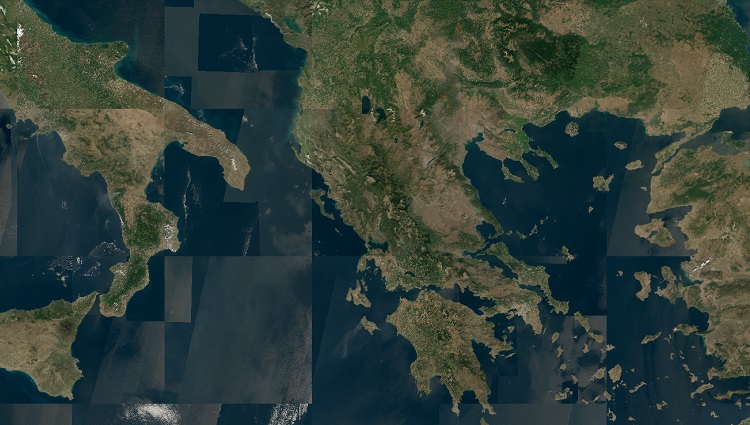
The drawings show global coverage obtained between 1 June 2017 and 1 September 2017 using data from the MODIS spectroradiometer aboard KA Terra and Aqua.

The current cloudless coverage of the Earth by medium and low-resolution satellite images is an important element in the regional and global systems that monitor the territorial changes caused by natural and man-made factors. For example, assessing the damage inflicted by forest fires caused by deforestation, volcanic eruptions, flooding and so on. Also, such types of coverage are popular as the base layer for cartographic web services.

The main stages of creating such coverage are: the selection of images, the masking of clouded areas, tonal adjustment of images taken at different times of the year, and pasting them into single coverage using so-called “cutlines”, which enable, to a certain extent, the joins between the pasted images to be hidden. Such operations, as a rule, are carried out in semi-automatic mode and require specialised software and highly qualified experts, which substantially increases both the time taken to create such a product and its cost.

Weather widget’s new geolocation and weather map functionality

Weather widget’s new geolocation and weather map functionality

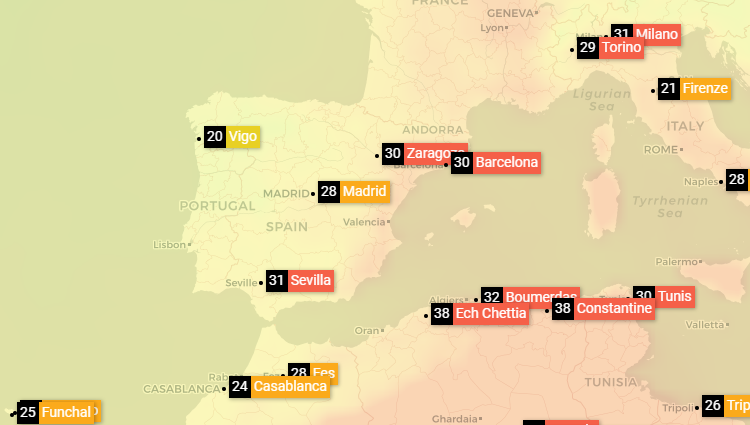
We invite anyone wishing to do so to try out our weather widget’s new geolocation and weather map functionality – https://openweathermap.org (please note that ‘https://’ is required in the URL), which can be targeted to your specific location.

You are invited to test the new Query Builder web interface for our VANE platform

You are invited to test the new Query Builder web interface for our VANE platform

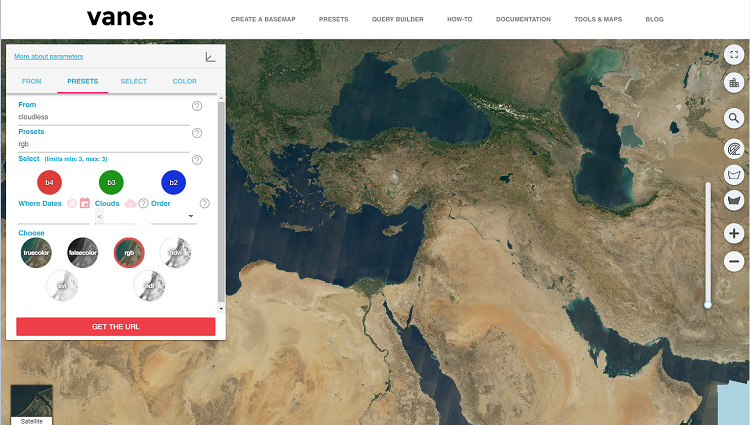
You are invited to test the new web interface Query Builder for our Vane platform.
You can use this simple tool to create your own map in just a few minutes, and with just one click receive a completed link for display on your site or app using a web map library like Leaflet, Open Layer, Mapbox and Google Map.

This version is an improvement over the previous one in terms of simplicity of use and layout. The user can select either one of the available data sources and the required combination of spectral bands or one of the derivative index products such as NDVI, EVI, etc. You can also set up display parameters, including clarity, contrast and gamma correction, or use one of the available schemes provided. After that, all you need is to get an API key and insert it in the prepared link, and you can use it in your programming product.
We are ready to answer your questions and will be glad to hear any proposals you might have.

The influence of temperature on plant productivity in agriculture: Accumulated temperature

The influence of temperature on plant productivity in agriculture: Accumulated temperature

Accumulated temperature is a weather parameter that directly influences the productivity of agricultural plants. All biological and chemical processes taking place in the soil are connected with air temperature. The heat supply of crops is characterised by a sum of average daily air temperatures that are higher than a biological minimum during a vegetation period. Both too-high and too-low temperatures spoil the course of biochemical processes in cells, and irreversible changes can be caused that lead to a stoppage of growth and the death of plants.

New API for accumulated temperature and precipitation data!

New API for accumulated temperature and precipitation data!

We are happy to announce our new APIs based on historical data and focused primarily on users from the agricultural sector – API for accumulated temperature data and API for accumulated precipitation data.

Accumulated temperature data is an index that denotes an amount of warmth. It is determined as a sum of average daily air and soil temperatures that exceeds a defined threshold of 0°C, 5°C or 10°C, or a biological minimum temperature level that is crucial for some specific plant.

Accumulated precipitation data is calculated as a sum of all parameters for a particular period.

Accumulated precipitation data for agriculture

Accumulated precipitation data for agriculture

Precipitation, mostly rains, has a huge impact on agriculture. For plants to grow, they need at least a small amount of water, and rain is still one of the most effective ways of watering despite the development of modern technologies.

Too much or too little precipitation is bad and even harmful for agricultural plants. Drought can destroy the harvest and increase erosion, and overly humid weather can trigger the growth of unfavourable fungi. Also, different kinds of plants demand different amounts of precipitation. For example, some succulent species require little water, while tropical plants need hundreds of inches of rain a year just to continue living.

The fluctuation in precipitation amounts is quite substantial in continental climates. They fluctuate more in a month than during a year. A considerable variation in precipitation leads to situations where drought takes place during the years with low amounts, thus forming areas of unstable hydration. With a long absence of rains and at high temperatures, the reserves of moisture in the soil dry out due to evaporation.

A previous arid season brings a shortage of crop yield even in a humid season, as the harvest lacks enough time for ripening. Thus disadvantageous conditions for ordinary plant development are established, and the crop yield of agricultural plants decreases or perishes.

Along with precipitation amounts, the number of days with precipitation in a month or a year is also a significant climatic index. Plants are sensitive to whether a given precipitation amount falls all at once during just a few days, or it rains often and the amount is distributed comparatively evenly throughout a month. For instance, even one great downpour in a prairie area in summer has little ability to improve an arid situation.

By employing a data set of precipitation amounts and a number of days, one can calculate an accumulated precipitation amount for any region during a specific period of time.

We use cookies to personalize content and to analyze our traffic. Please decide if you are willing to accept cookies from our website.