
03 Apr 2019
The first version of our updated Dashboard!
We are pleased to tell you that we have launched the first version of our updated Dashboard!
03 Apr 2019
We are pleased to tell you that we have launched the first version of our updated Dashboard!
18 Mar 2019
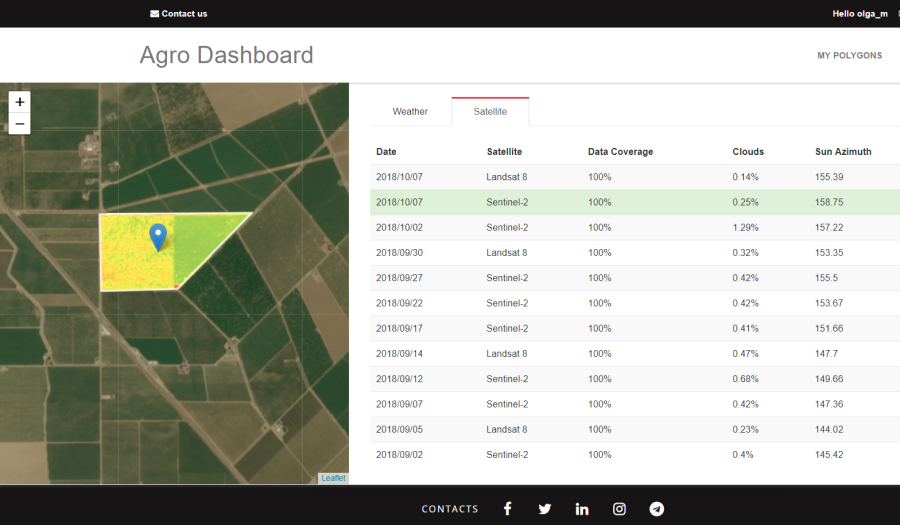
The main purpose of this significantly advanced version of the Dashboard is to visually demonstrate to you all the data that we provide in our Agricultural API.
17 Oct 2018
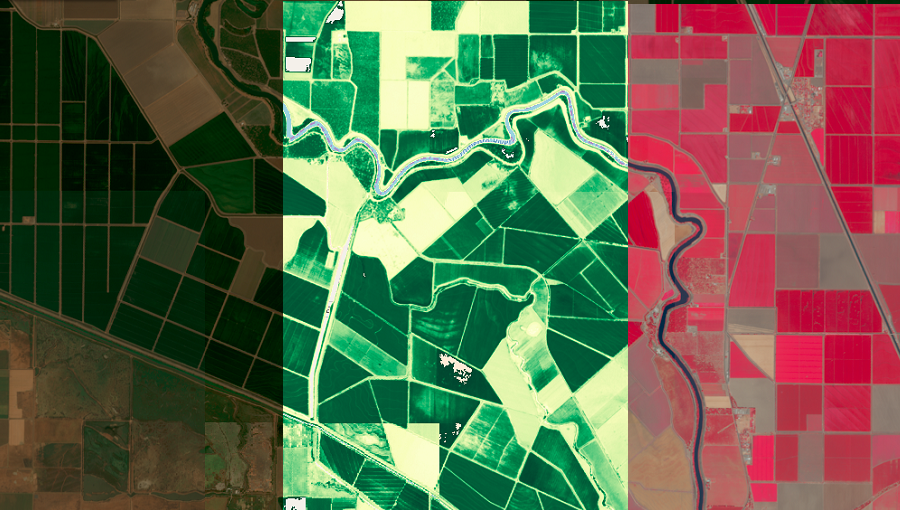
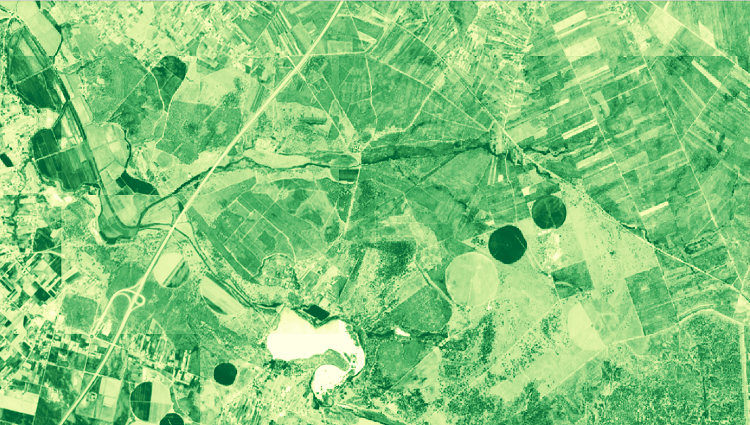
The Dashboard for Agricultural Monitoring is a service created for visual demonstration of satellite data (NDVI) and weather data (forecast, historical and accumulated parameters), which you can ge...
19 Sep 2018
In the past, it was not easy to work with satellite imagery and use the images in applications. You had to have deep expertise in the satellite imagery area and have access to massive computing capacity. Fortunately, now this data is availabl...
06 Aug 2018
This article is a step-by-step description of how to work with polygons using our QueryBuilder and Agro API...
06 Aug 2018
1) Satellite data search.
1.1. Selection of suppliers or distributors of satellite data.
1.2. Data search in archives. Search is based on the following criteria: date of satellite imagery, percentage cloud coverage, type of satell...
09 Jul 2018
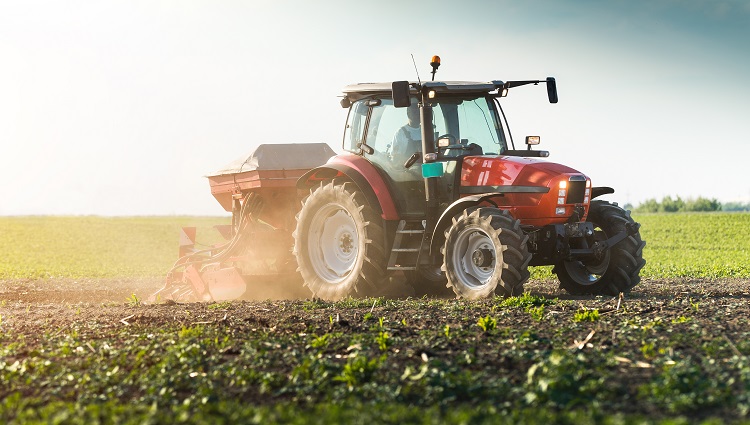
This April, OpenWeather presented a brand new product, the Agro API, which was intended to change the working process of agricultural application...
16 May 2018
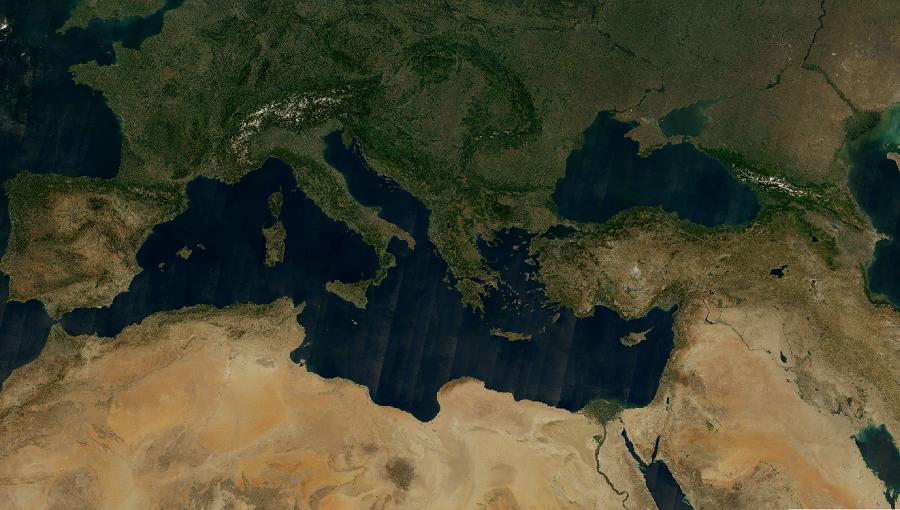
In this article, we would like to look in more detail at one of the essential elements of our Agro API: the Satellite Images API. The #api #agriculture #satelliteimages #smartfarming
07 May 2018
Objectives
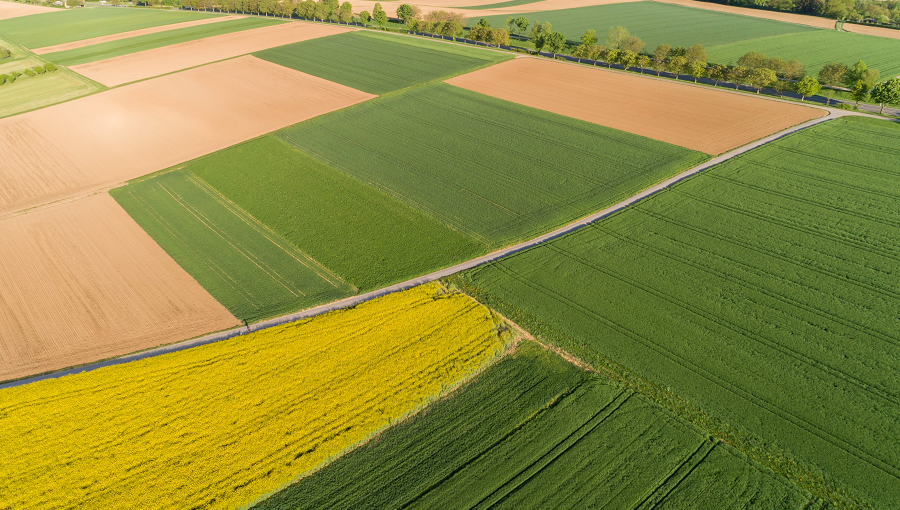
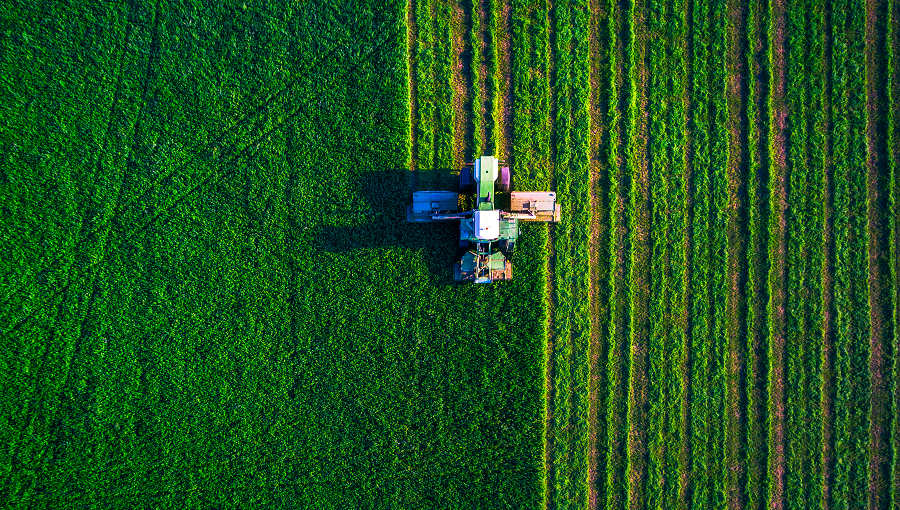
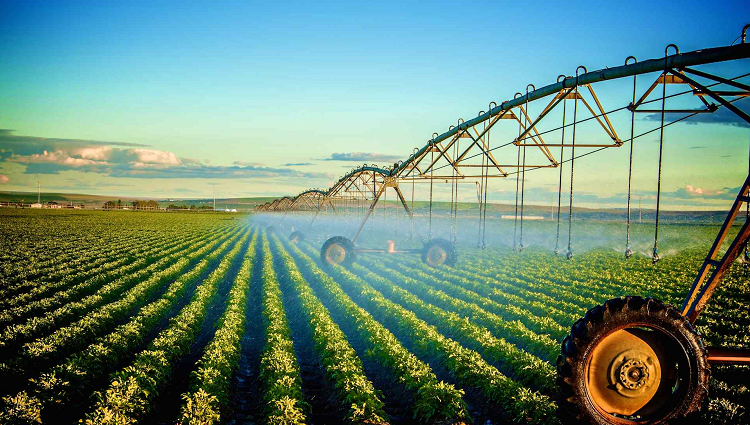
As farms mainly consist of crop fields, which can be hundreds of acres in size, much time and a great deal of resources are demanded of farmers...
23 Apr 2018
The OpenWeather team are pleased to announce that we are launching a new product aimed primarily at specialists developing agricultural services and addressing the specific requirements ...
Download OpenWeather app