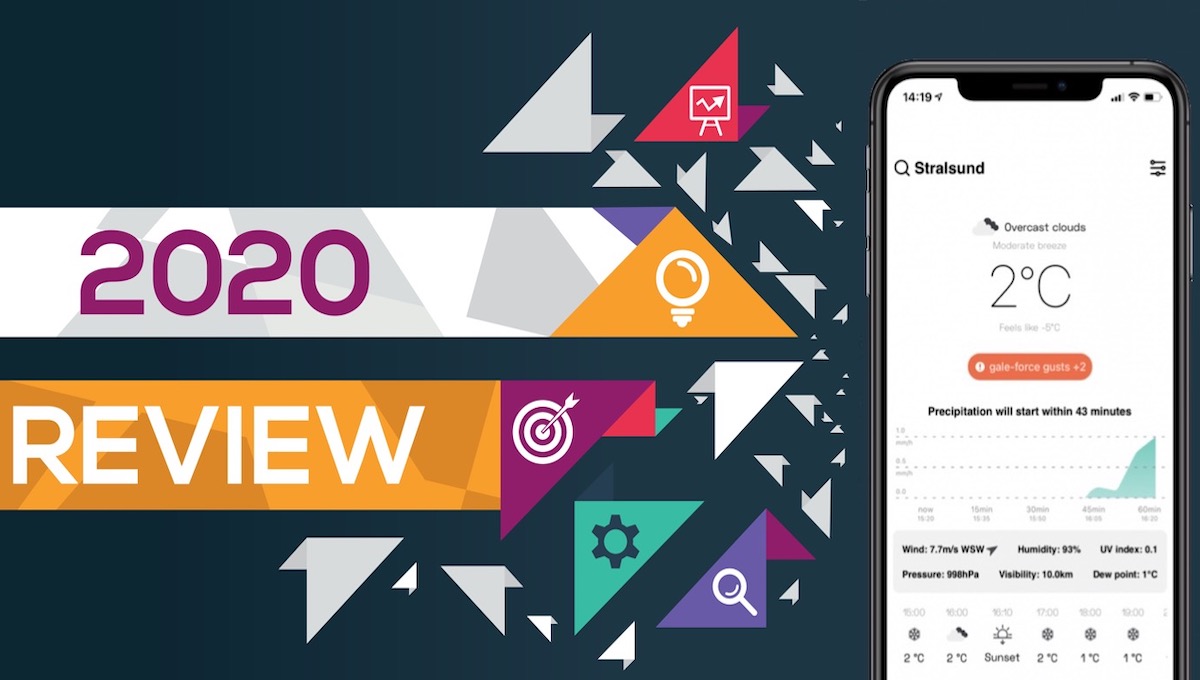
So the, new year, 2018, has come, and it’s time to sum up the results of the past year for our company, OpenWeatherMap (UK, US and Latvia), developers of one of the best weather APIs in the world. A lot has happened and much has changed.
During the year, our number of users grew from 600,000 to 1 million. We participated in the Startup Grind Global Conference in Silicon Valley, where the team from OpenWeatherMap was named in the top 50 Startup Exhibitions of 2017. Our mature team was filled up with excellent professionals and wonderful people.
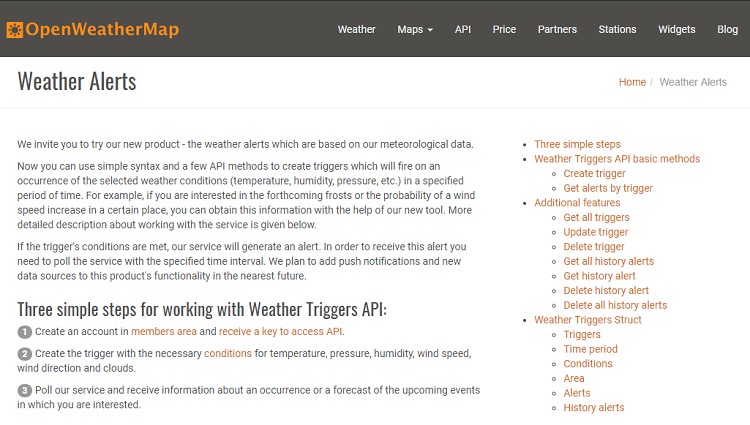
We did a lot of new things and qualitatively improved our current developments. In 2017, we were pleased to present to you:
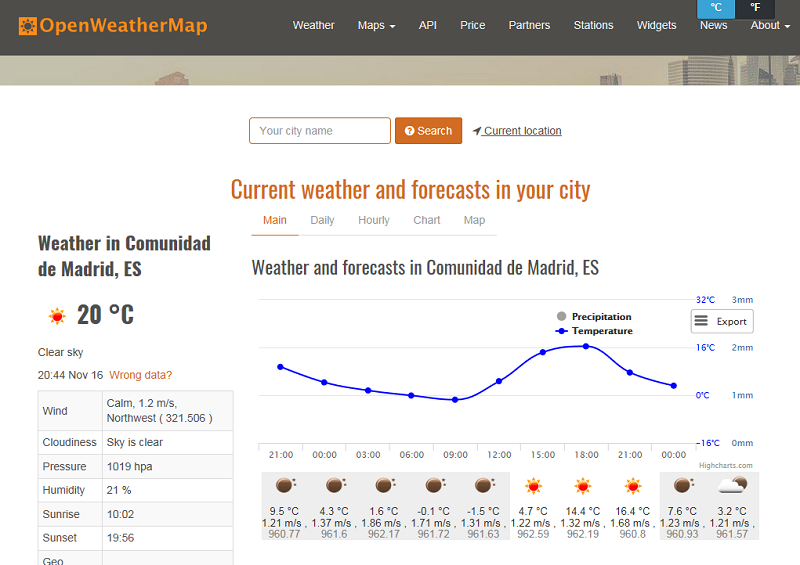
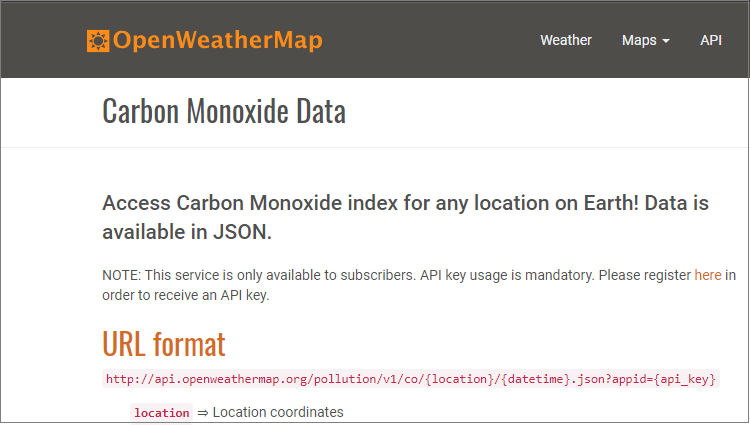
Weather data: API and Weather Maps
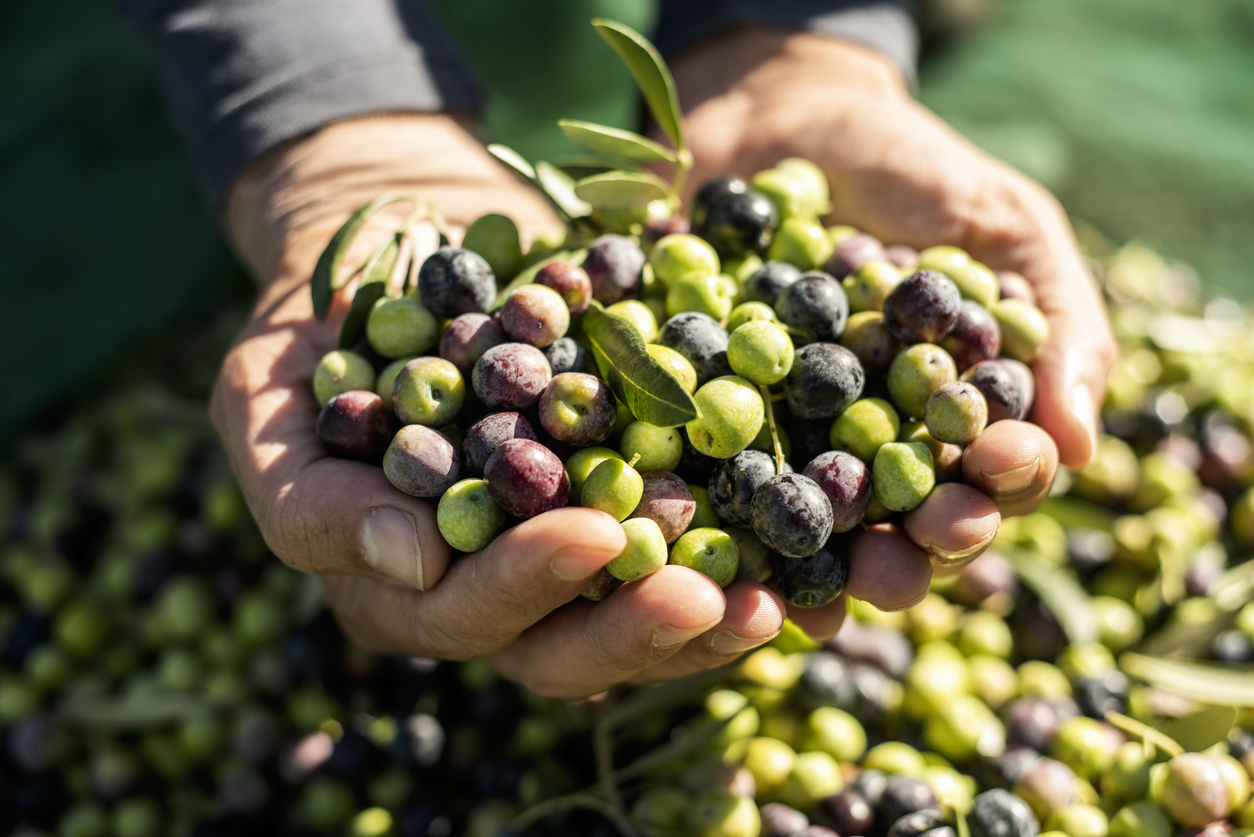
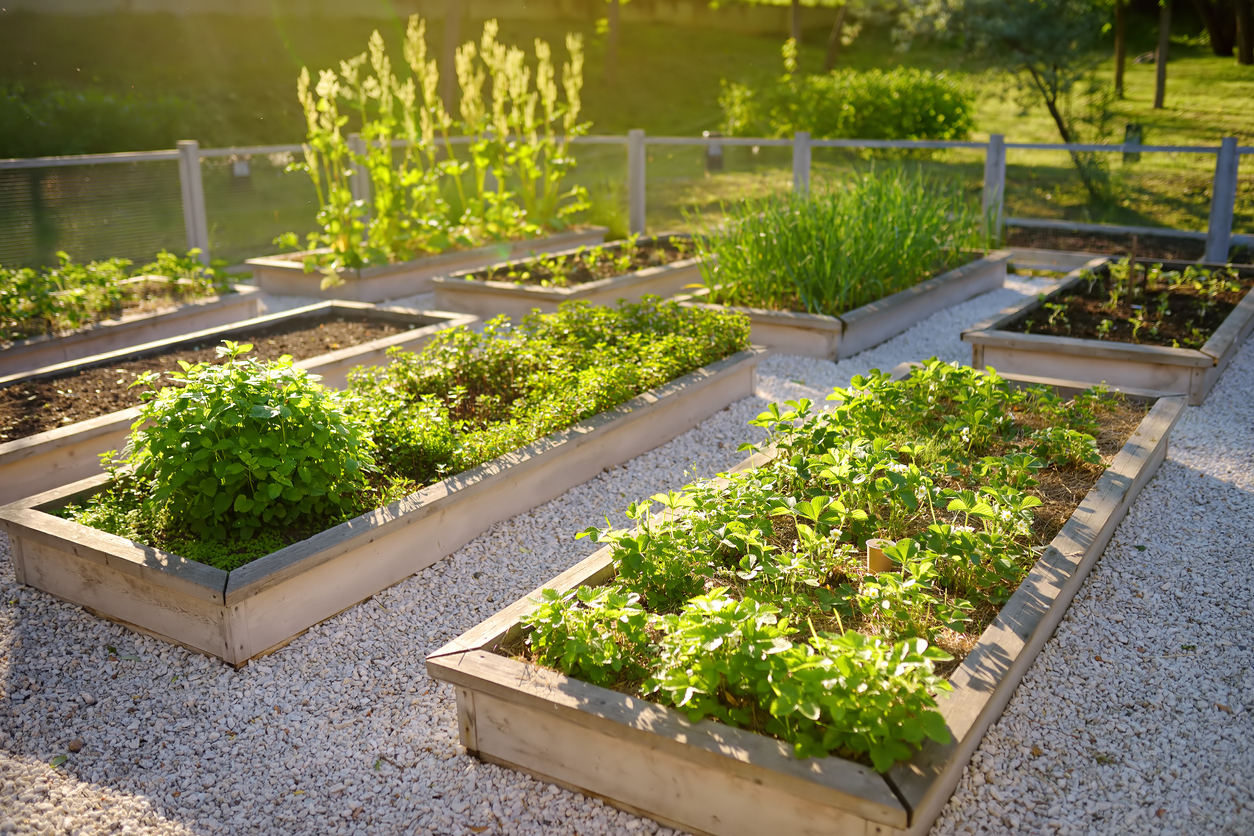
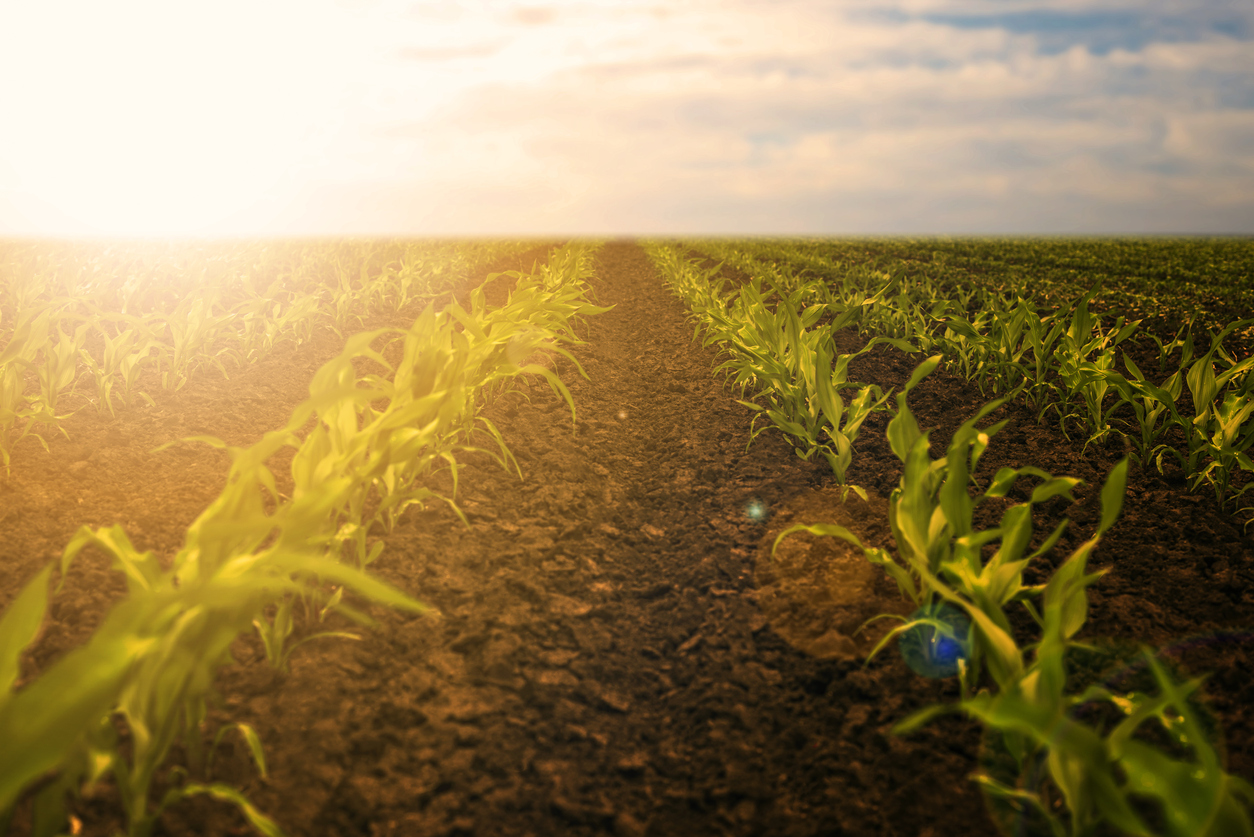
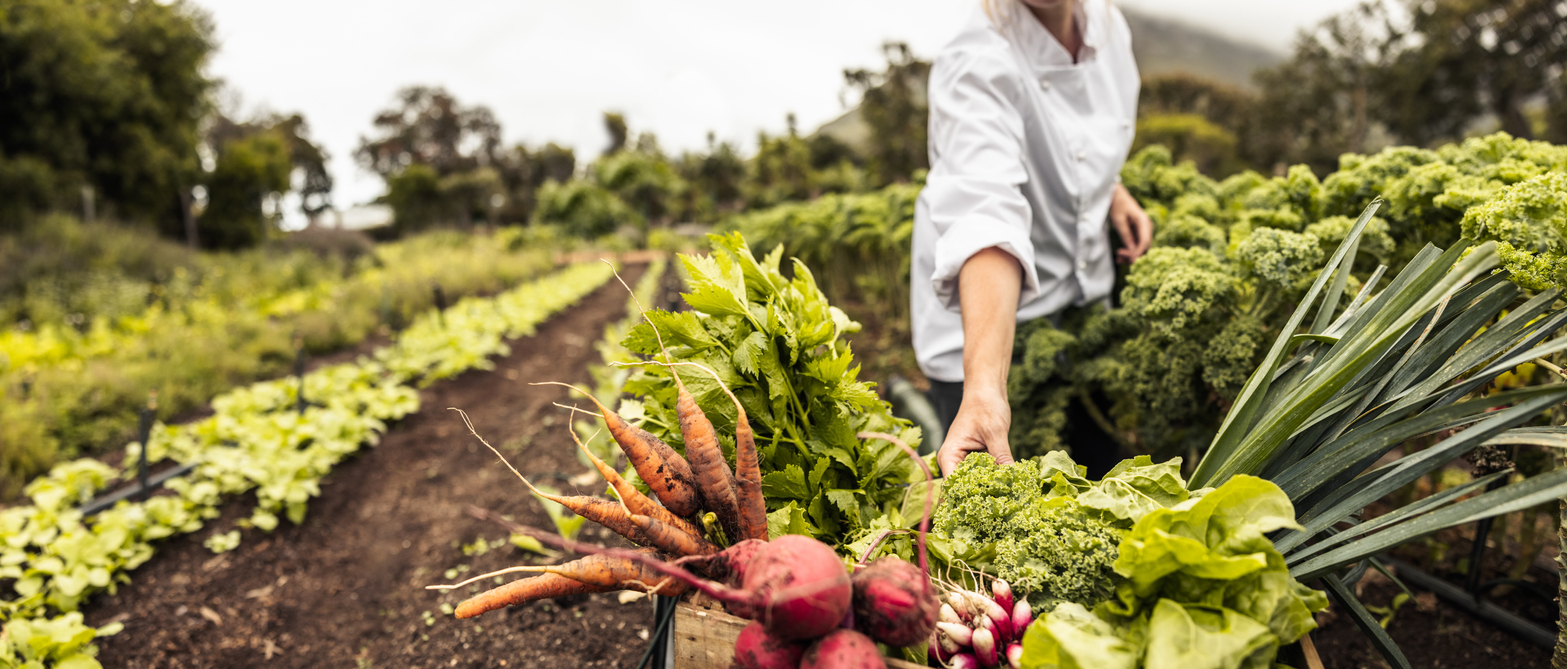
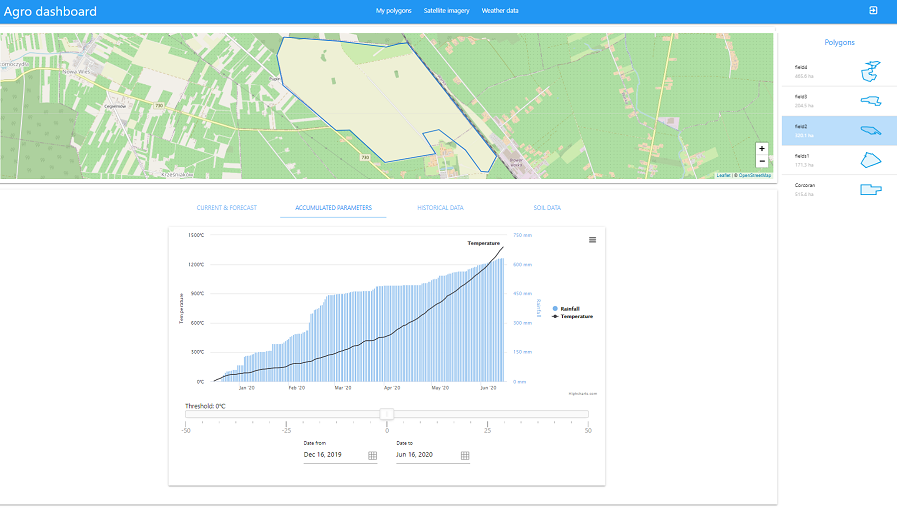
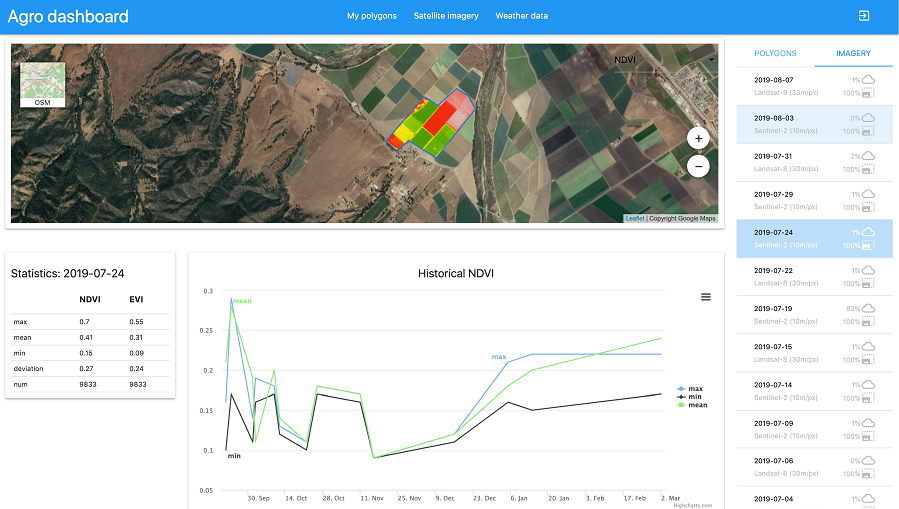
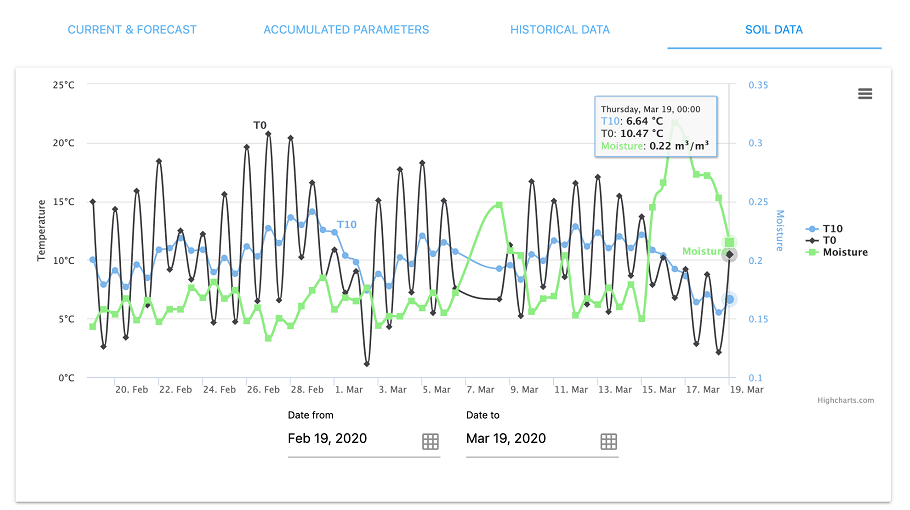
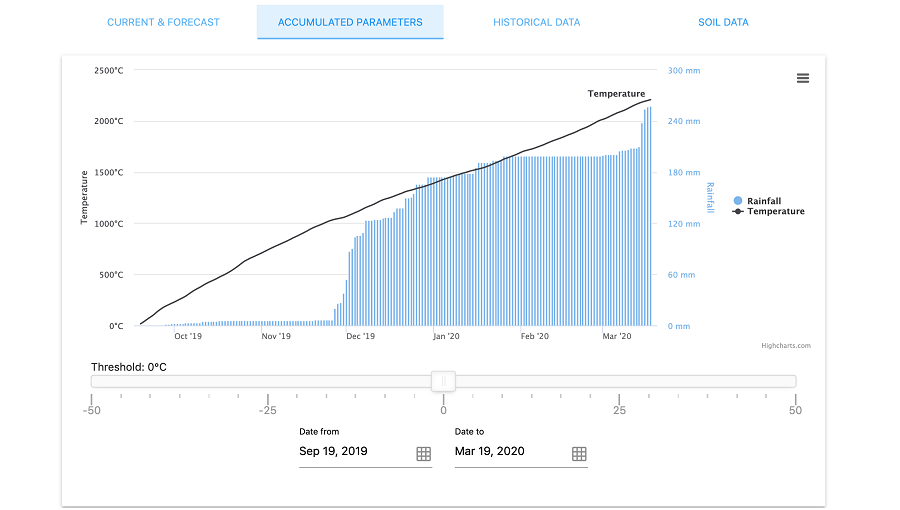
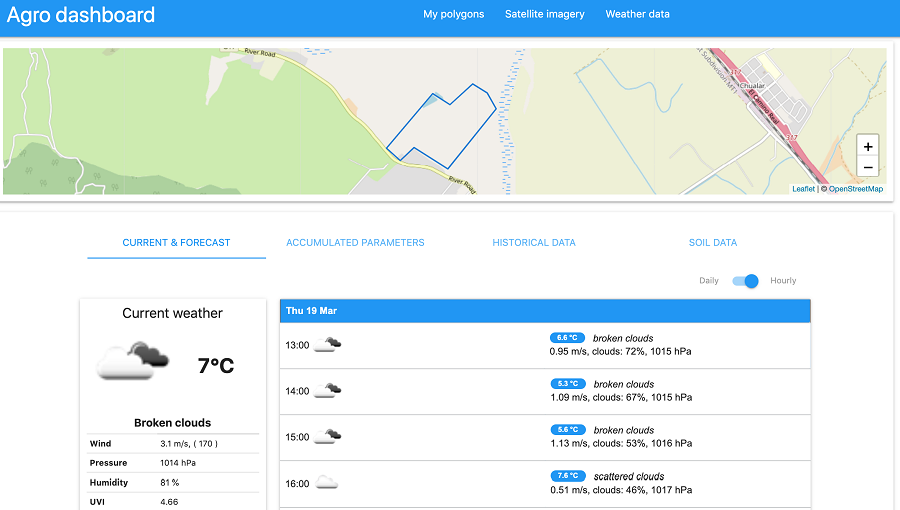
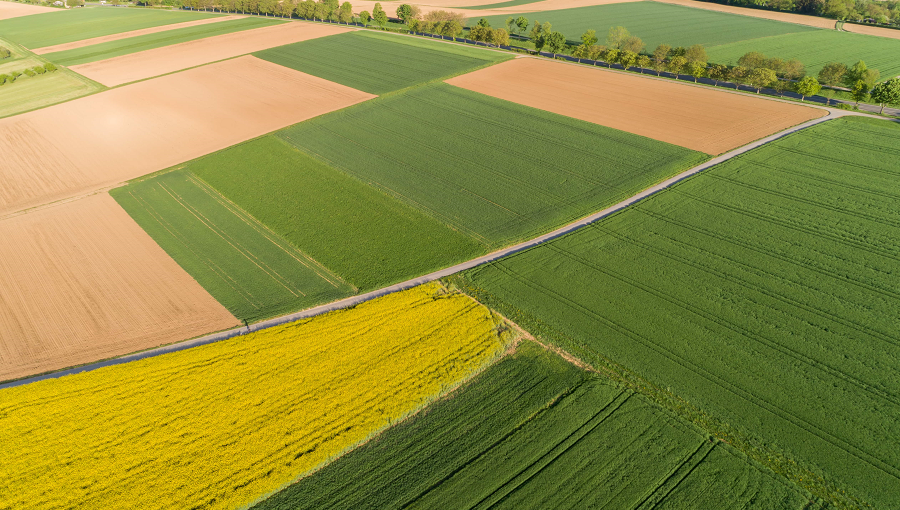
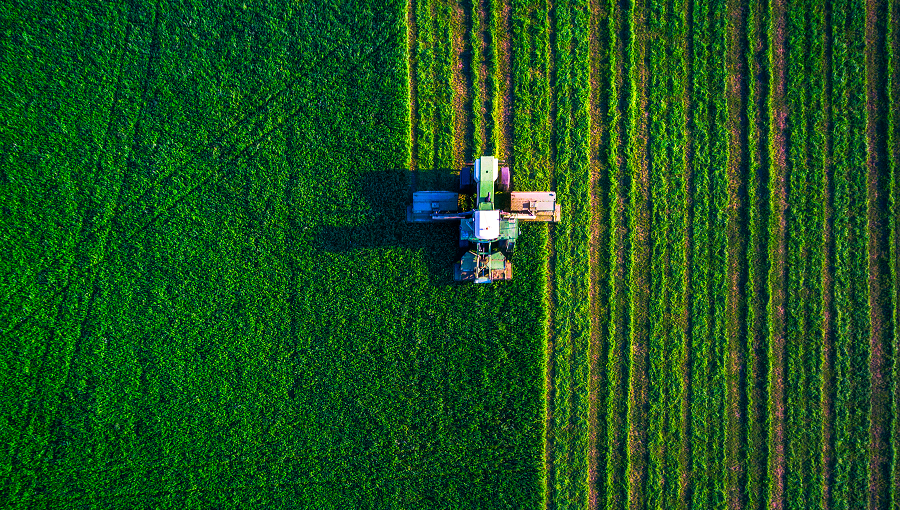
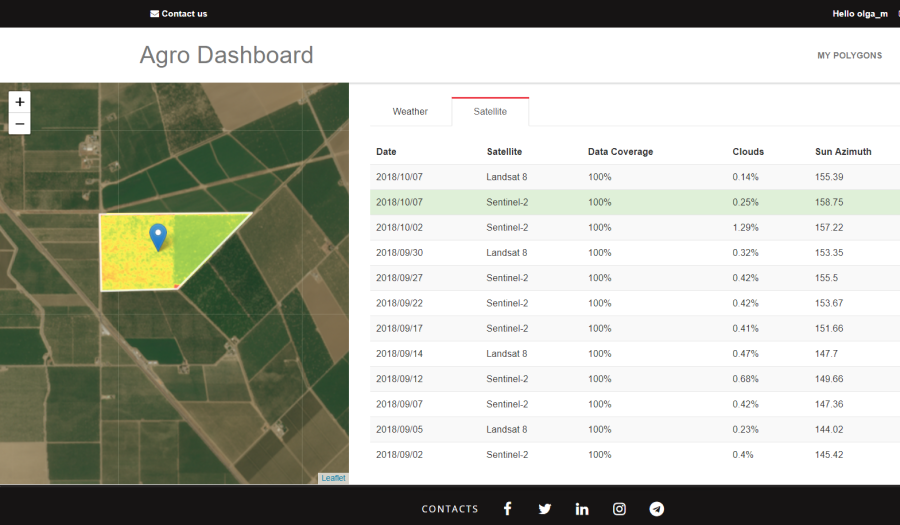
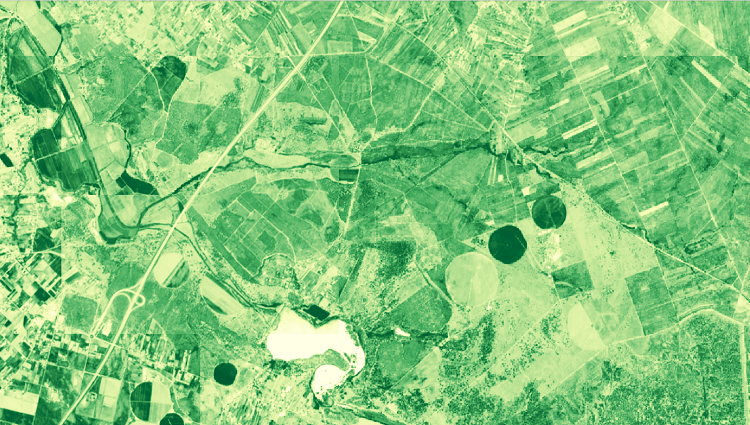
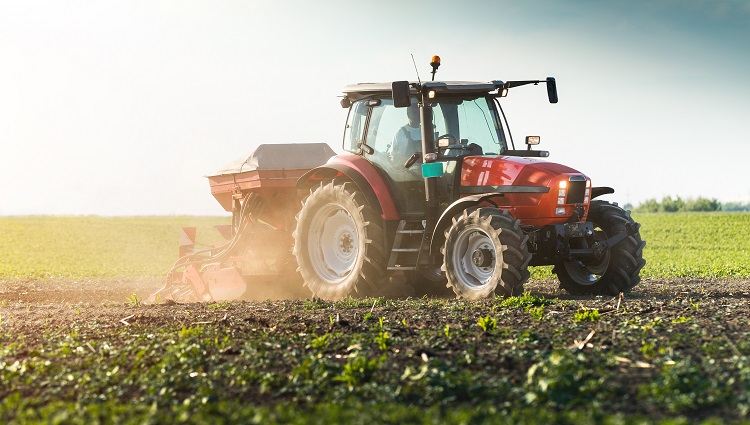
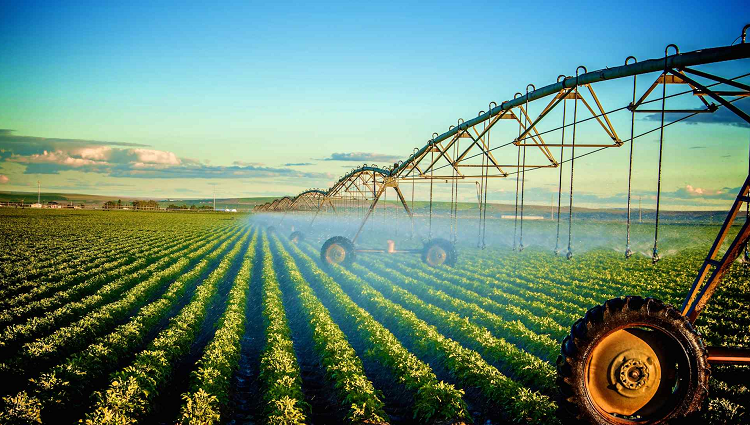
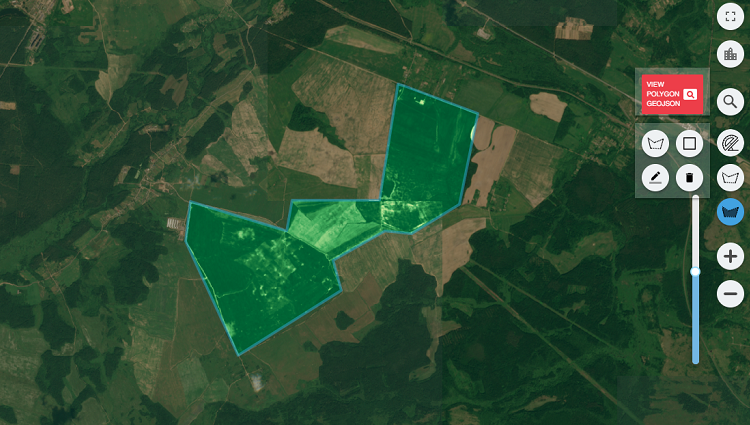
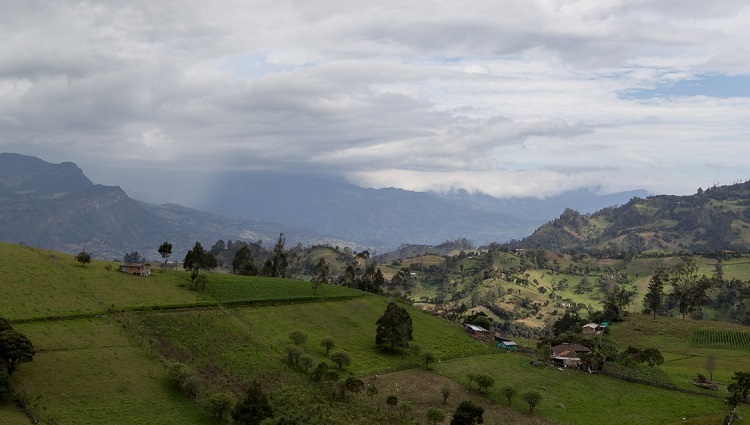
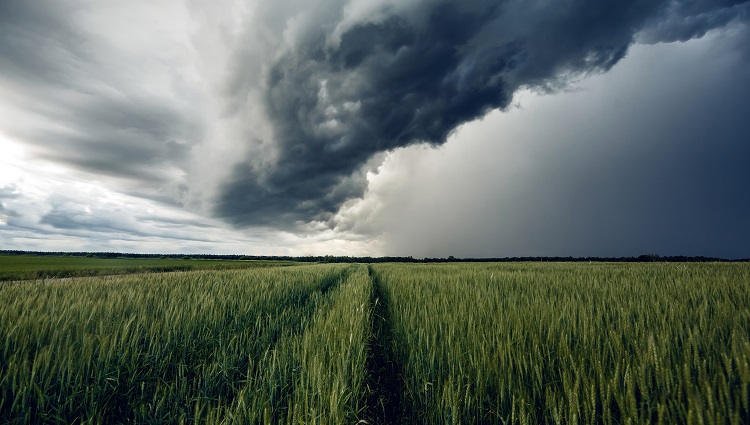
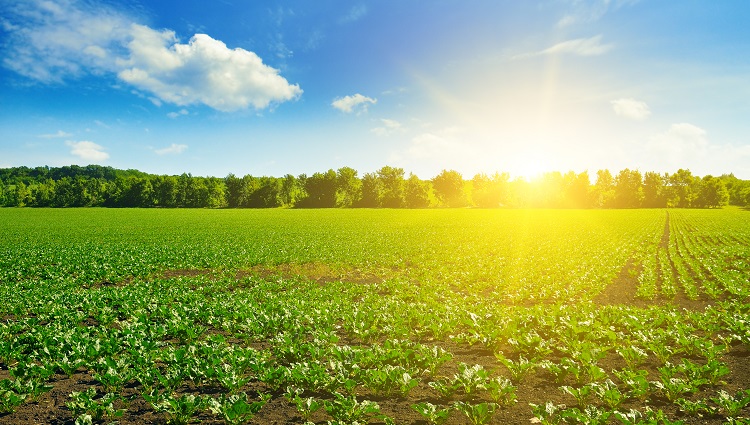
- The Open Dashboard for Agricultural Monitoring can help give you an idea of the possible use for meteorological and satellite data in your agricultural applications.
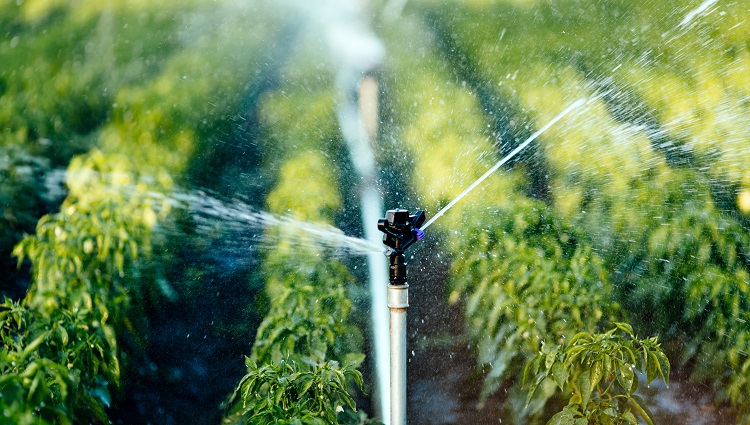
- Specially for the agriculture sector, we launched an API for accumulated temperature data and another for accumulated precipitation data.
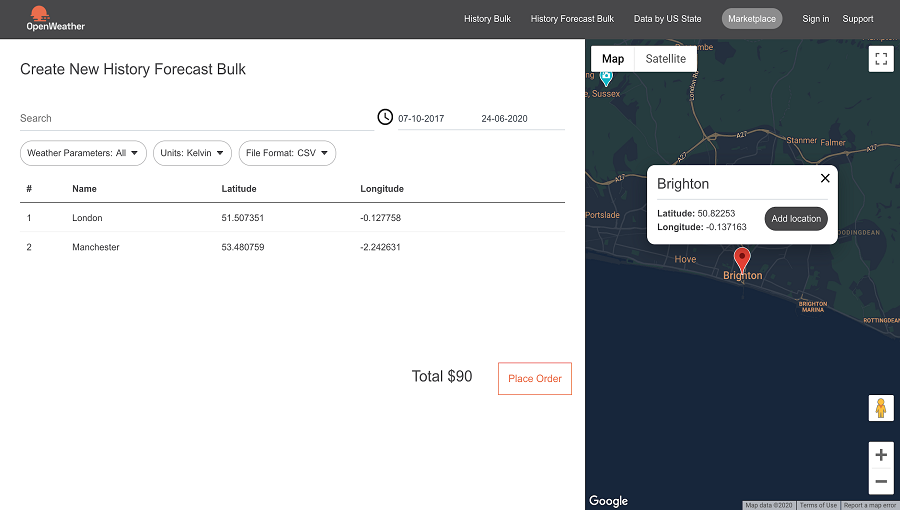
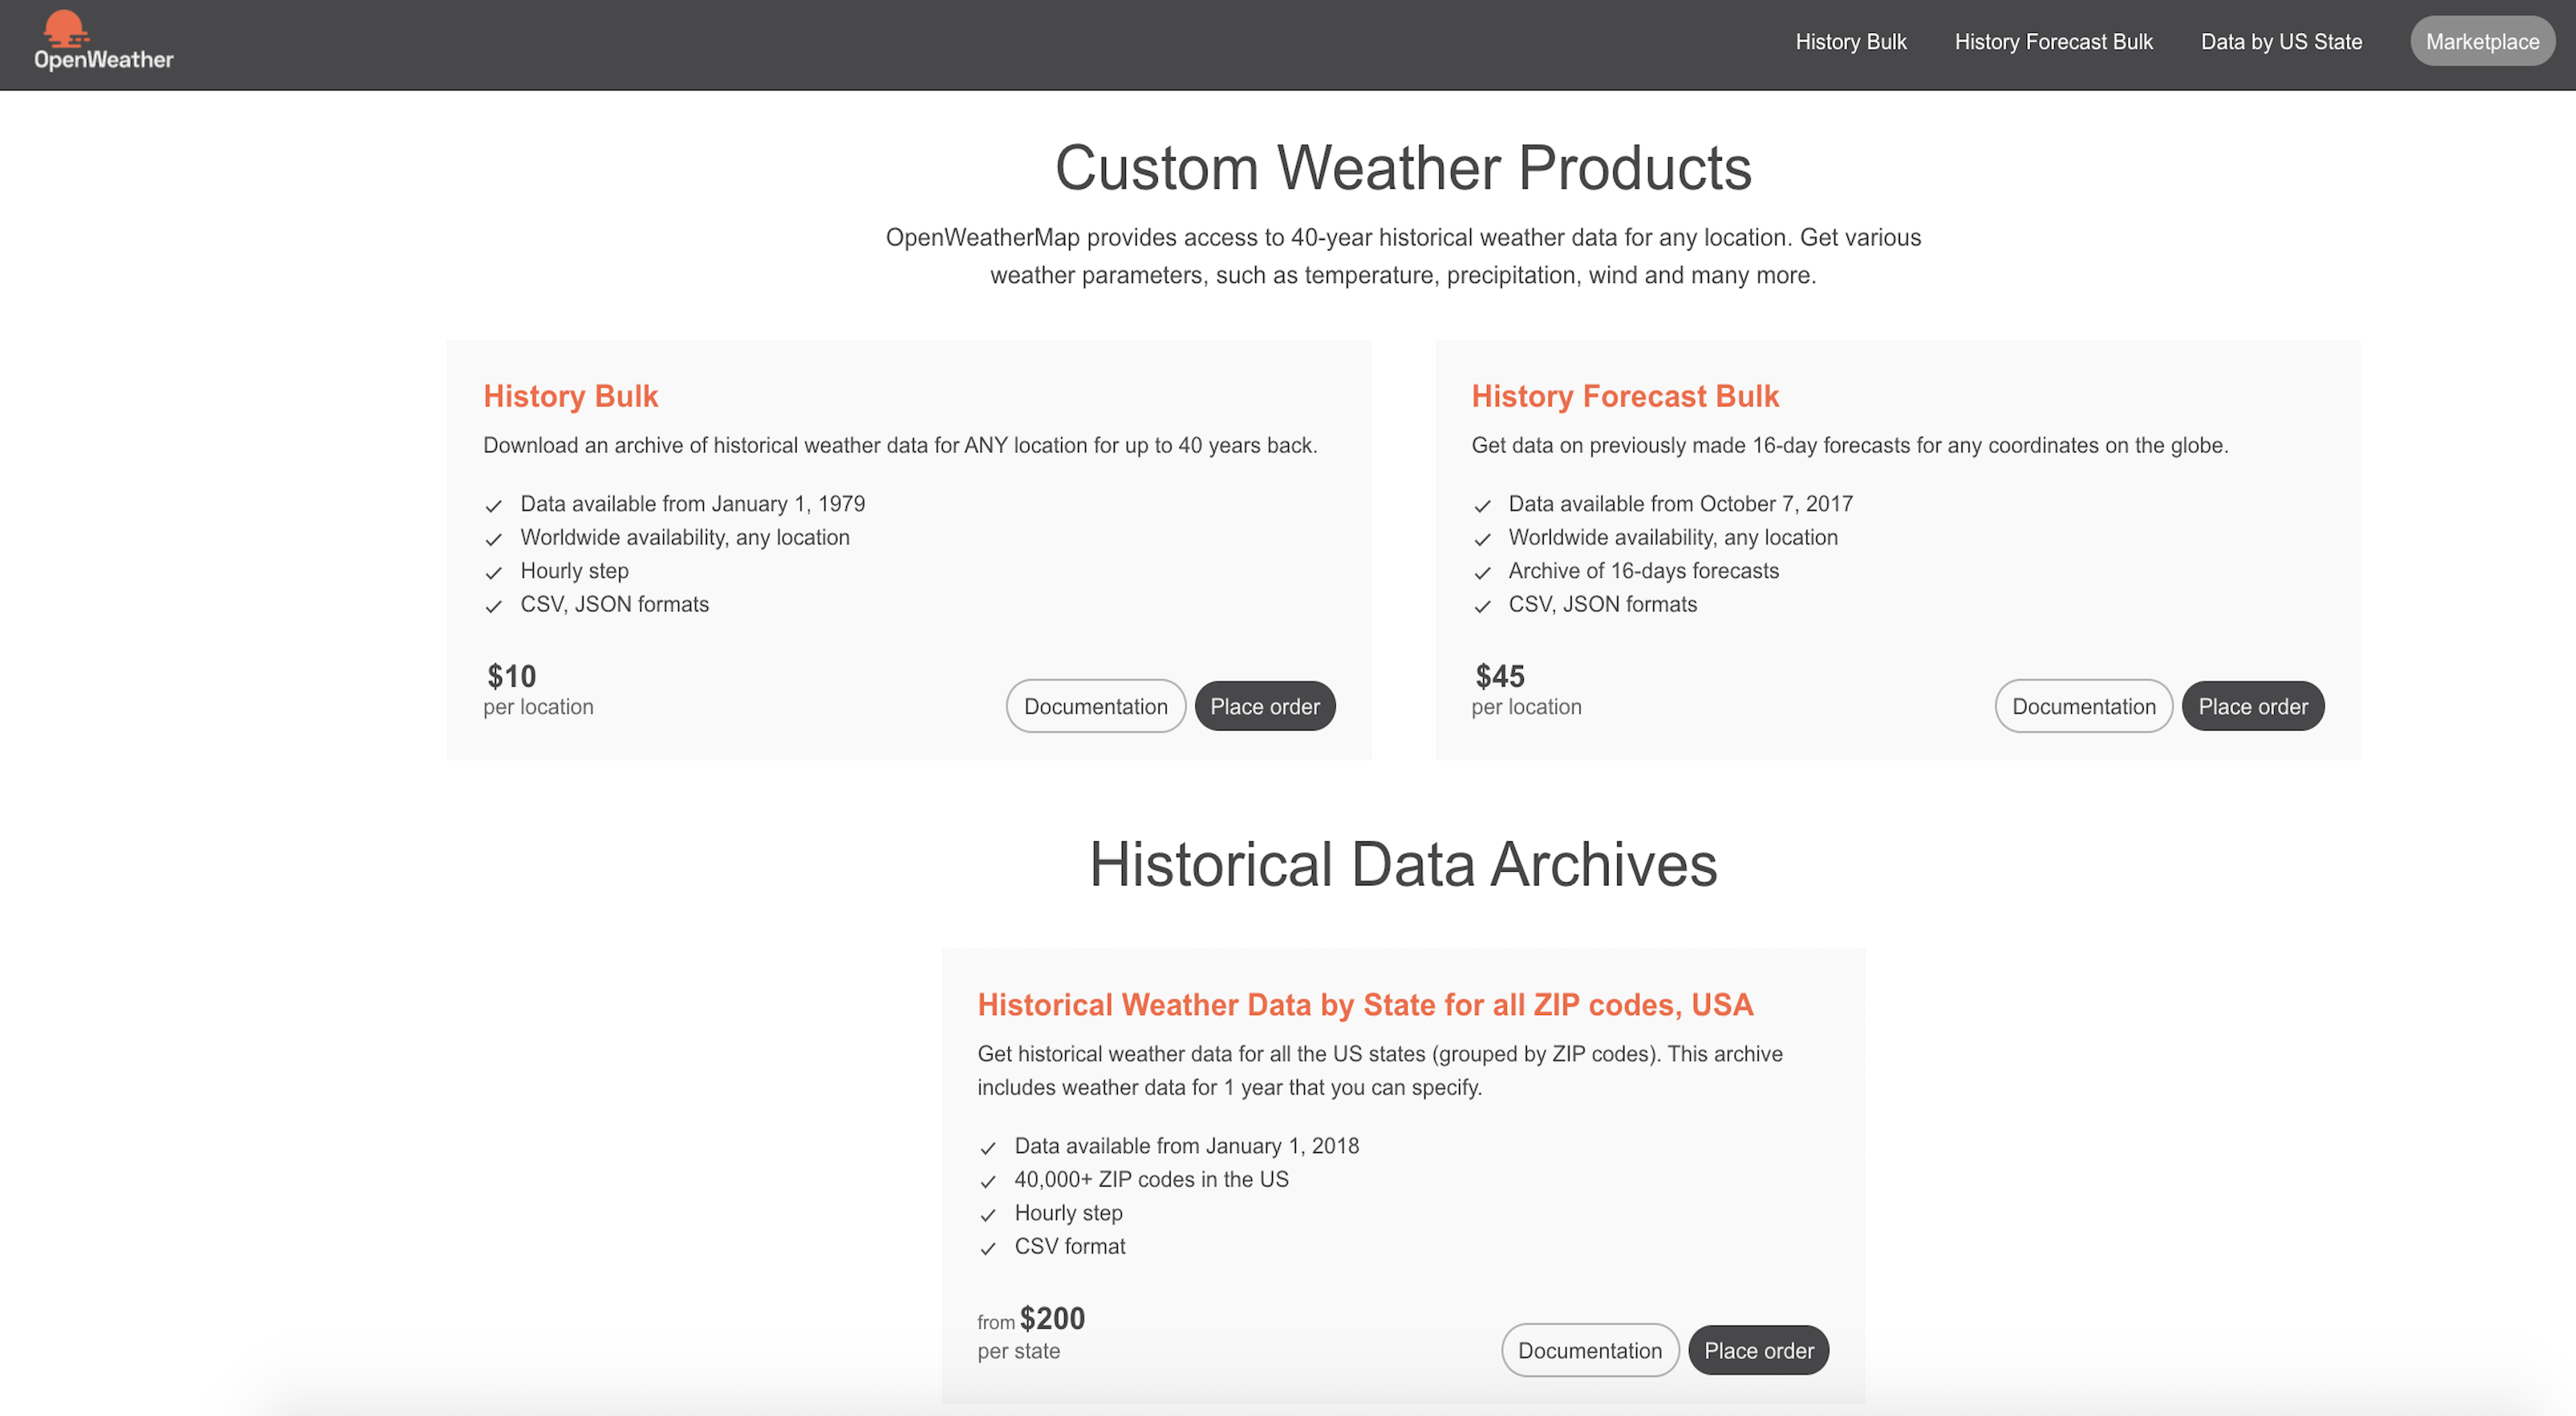
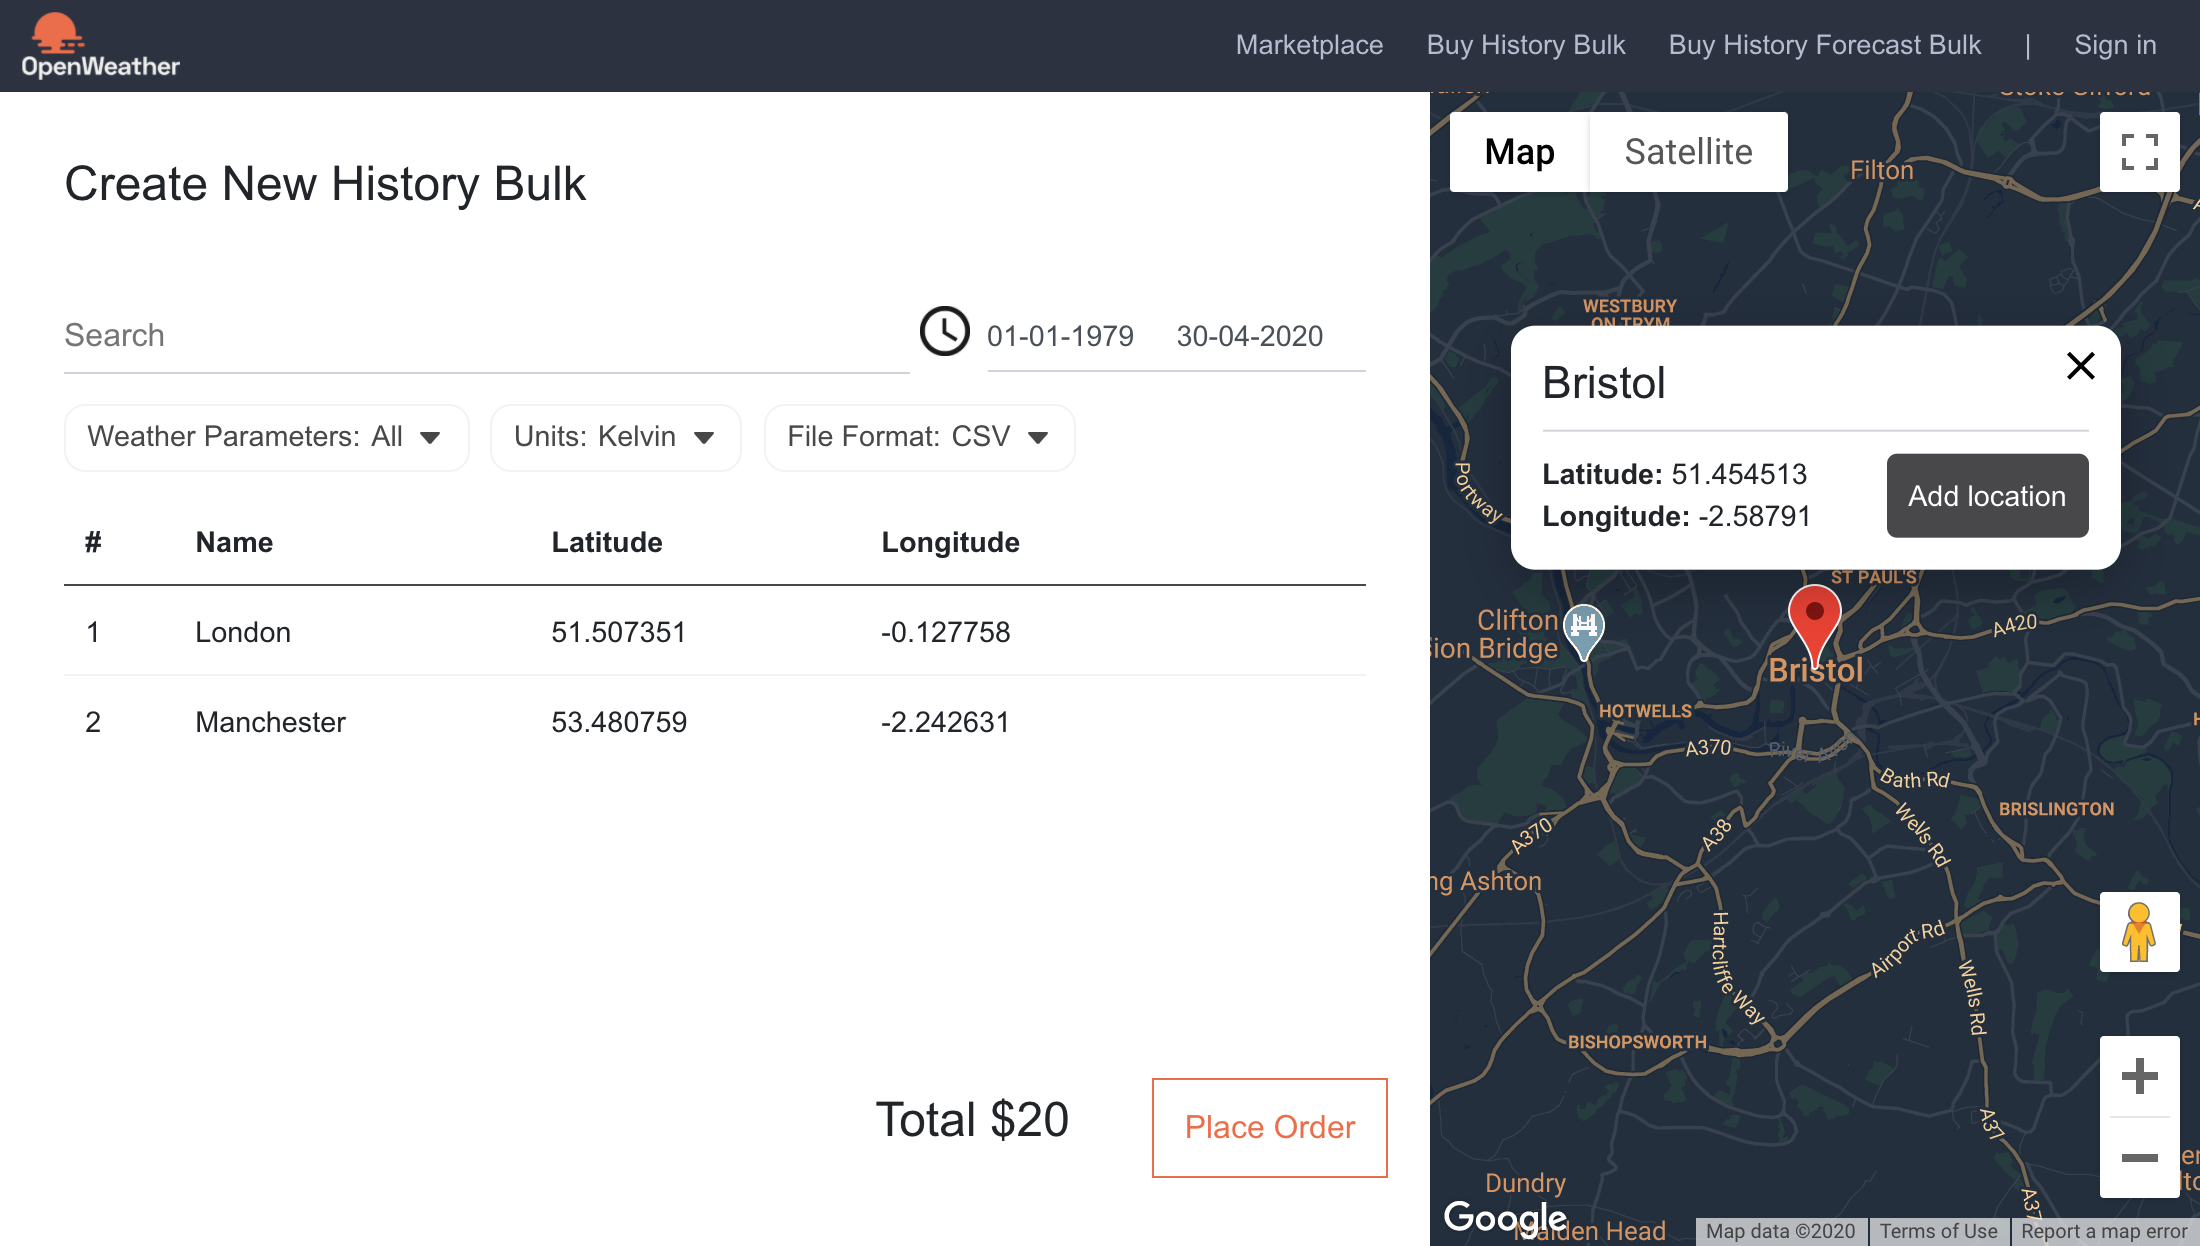
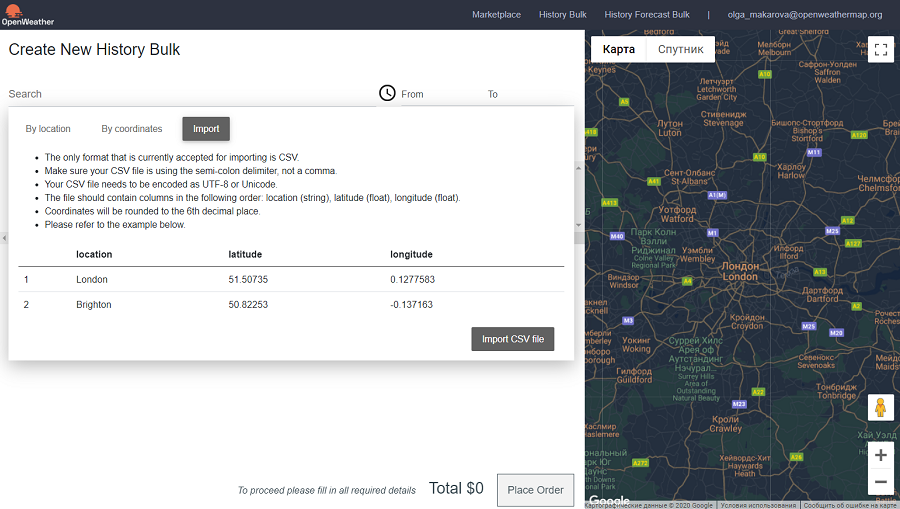
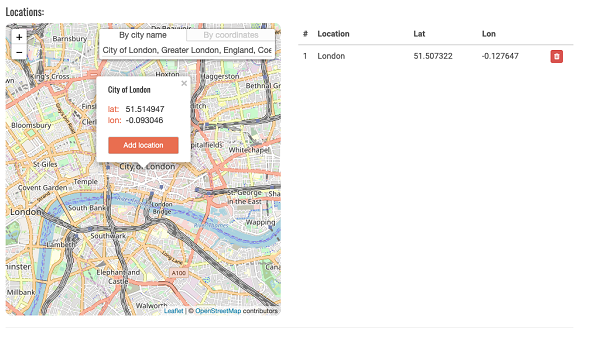
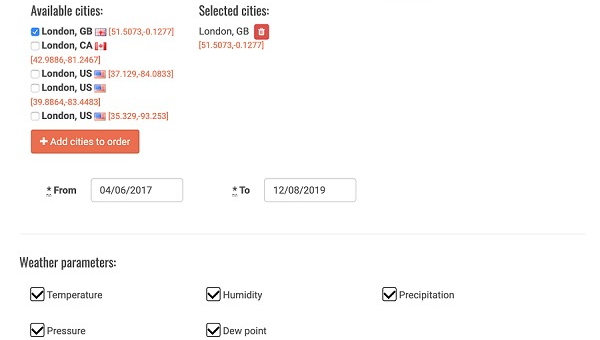
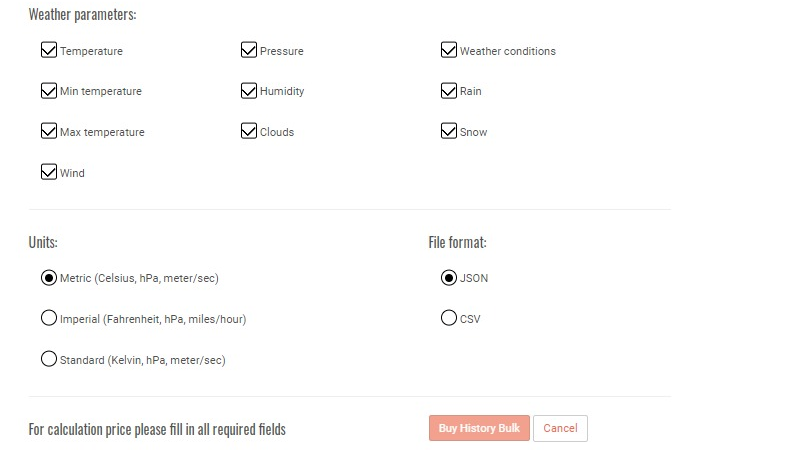
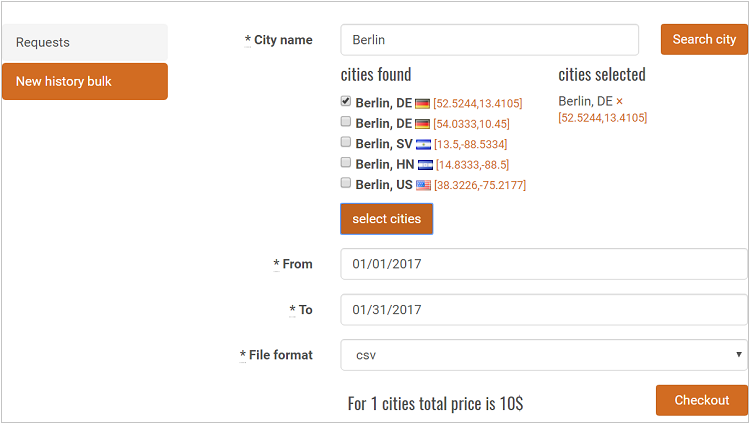
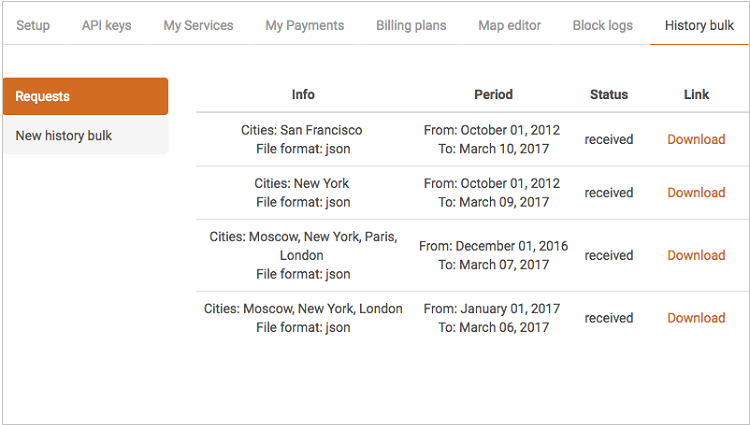
- The Weather Historical Bulk service. Now you can simply choose a city/town (or several cities/towns) and download an archive, which contains a bulk file with the weather history for up to 5 years – any day or week, or even several years.
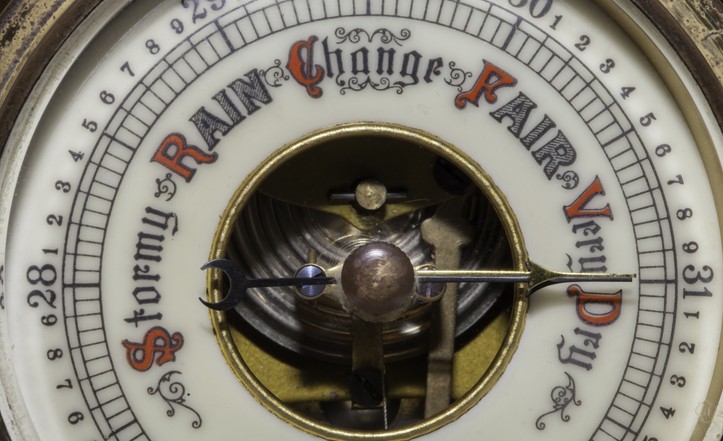
- A new and improved version of an API for UV-index.
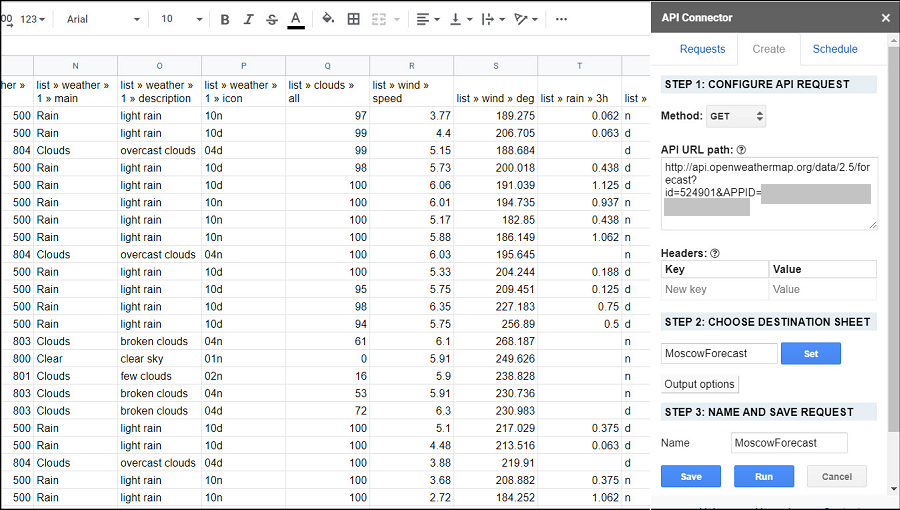
- Throughout the entire year, we worked constantly on our history weather API. During the year, the amount of data supplied and the speed of processing that data increased significantly. Also, we made it possible to quickly upload data in a format that doesn’t require additional processing and can be understood by any user.
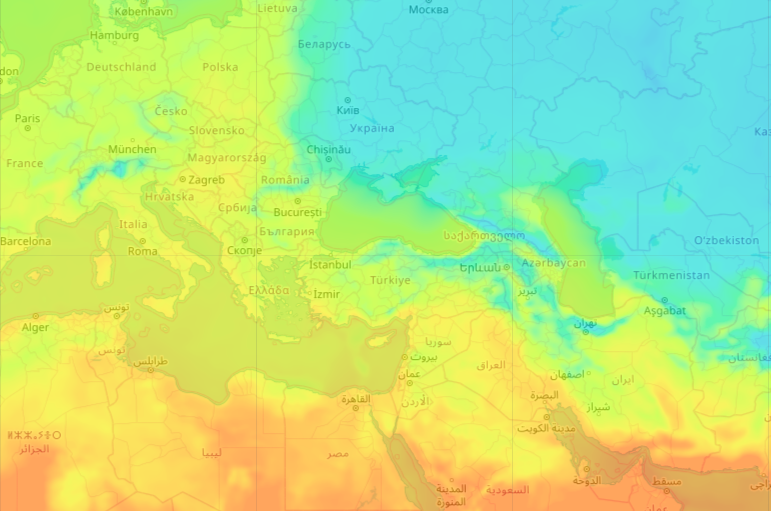
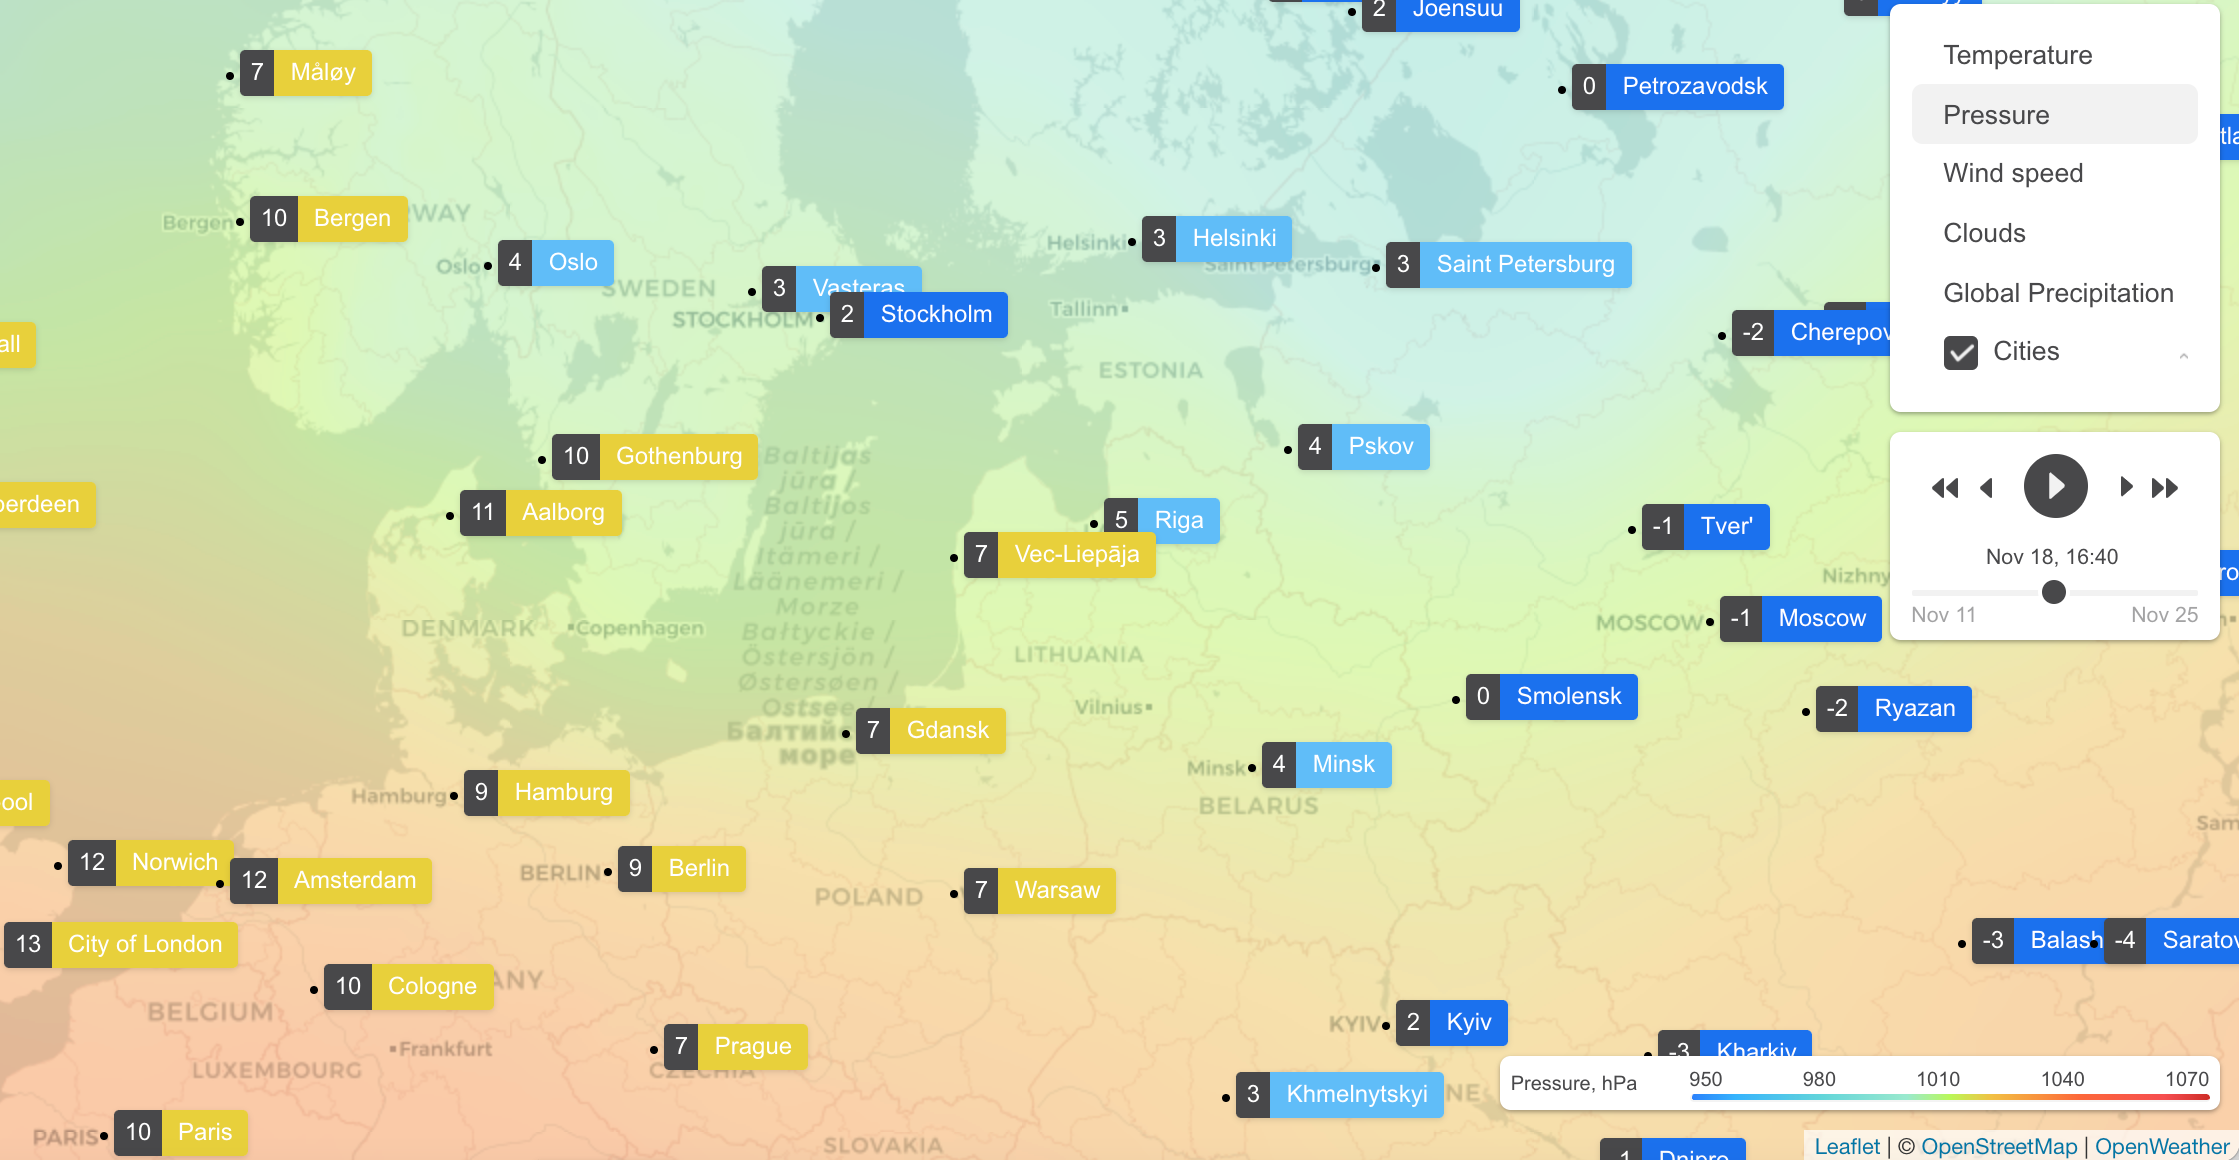
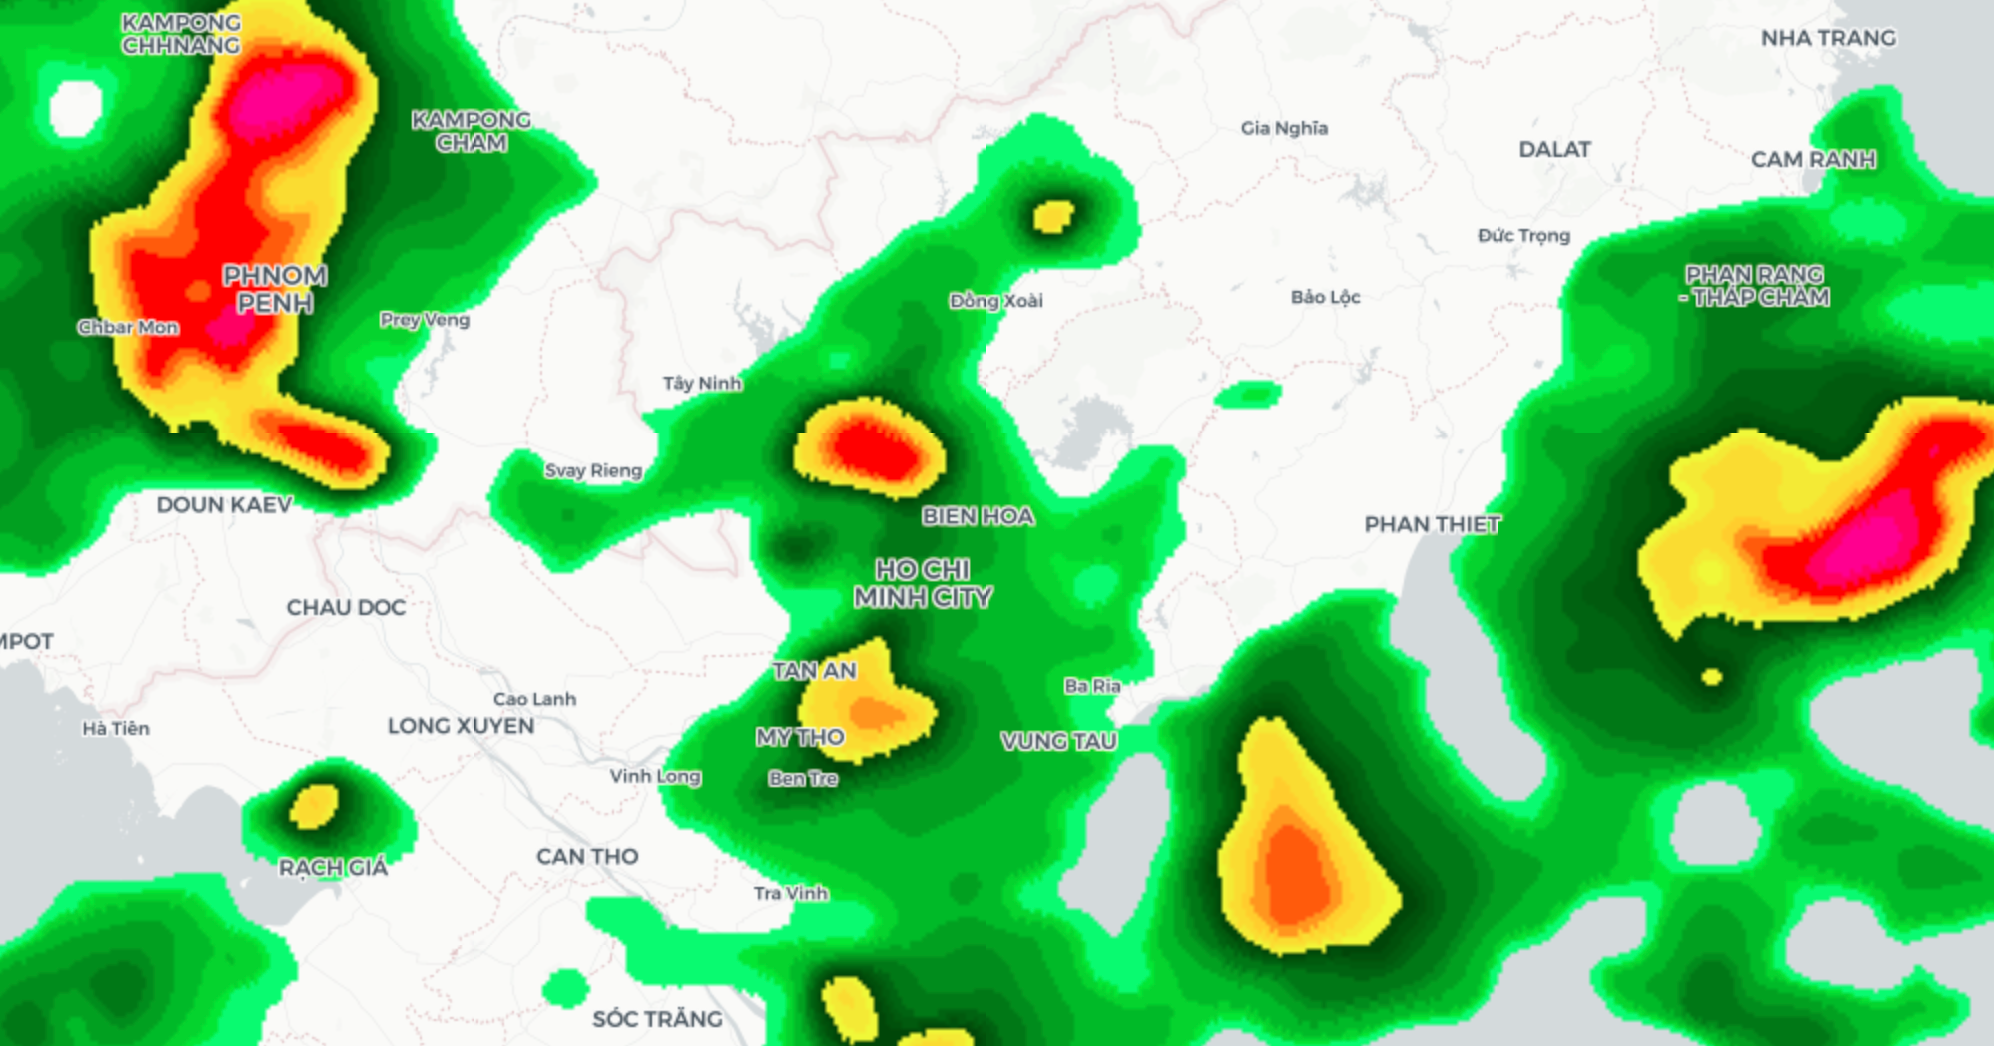
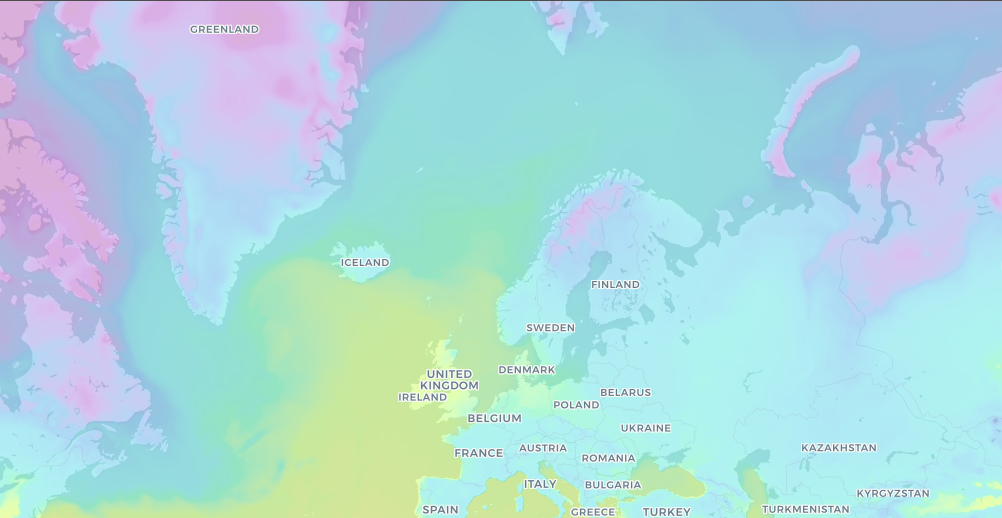
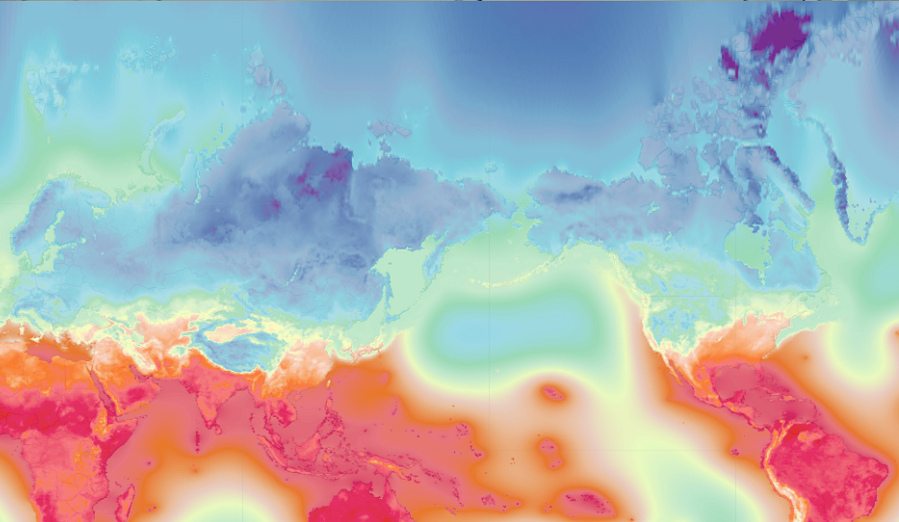
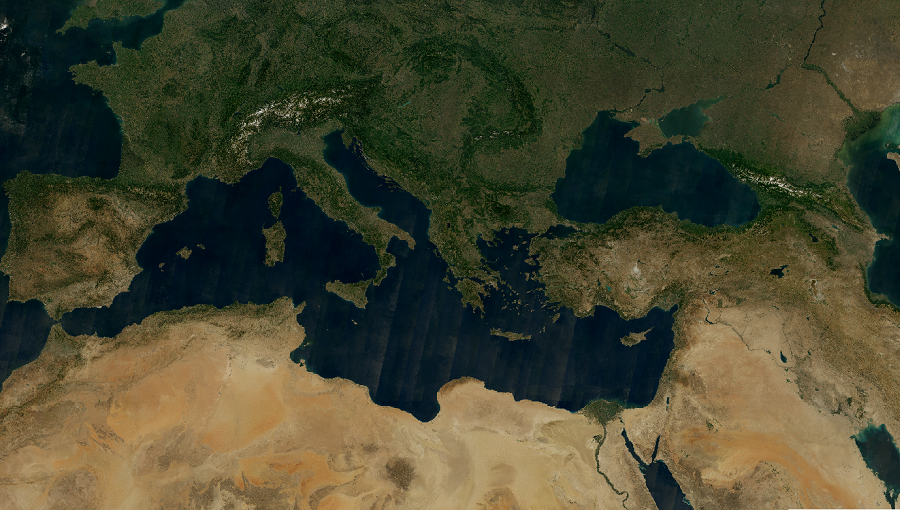
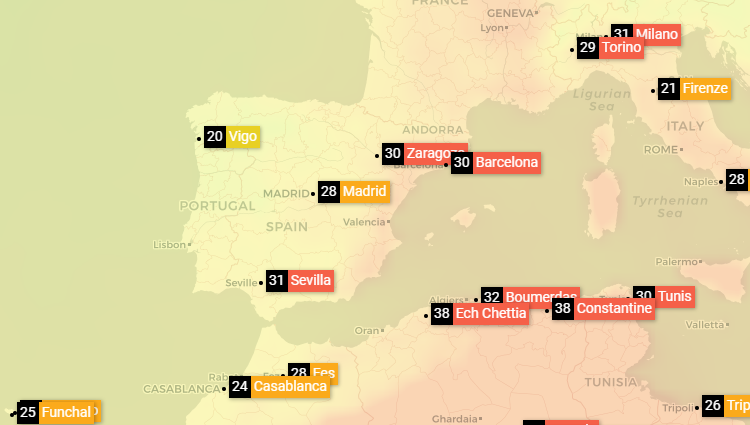
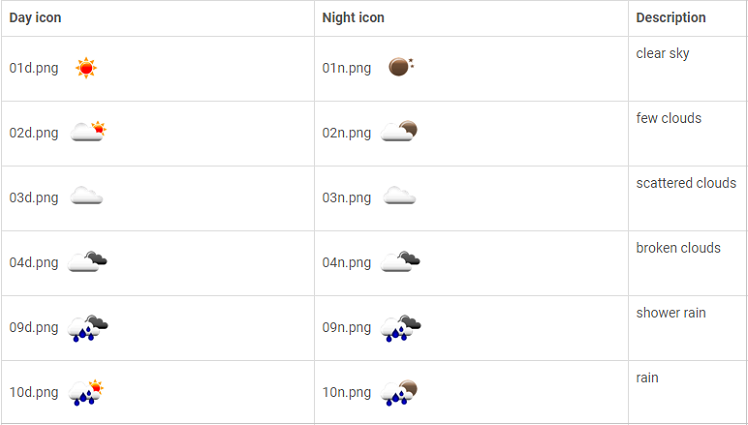
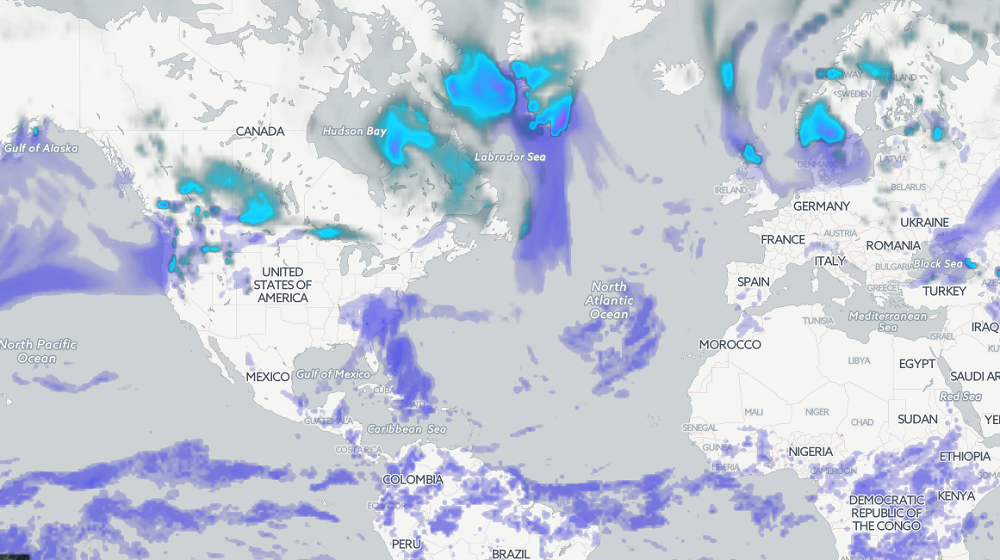
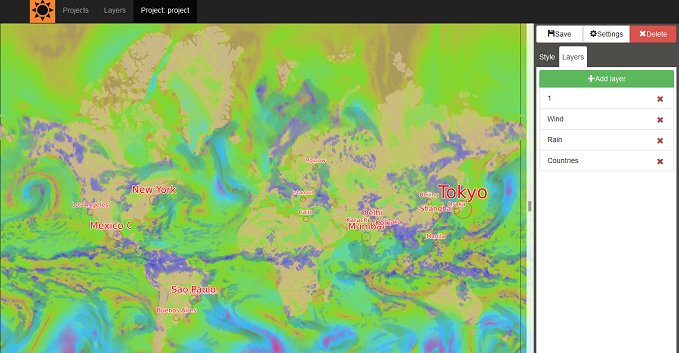
- Our Weather Maps app changed qualitatively in 2017. We added the ability to switch the layers of weather and satellite maps, create various combinations with them, and connect them to mobile and web apps.
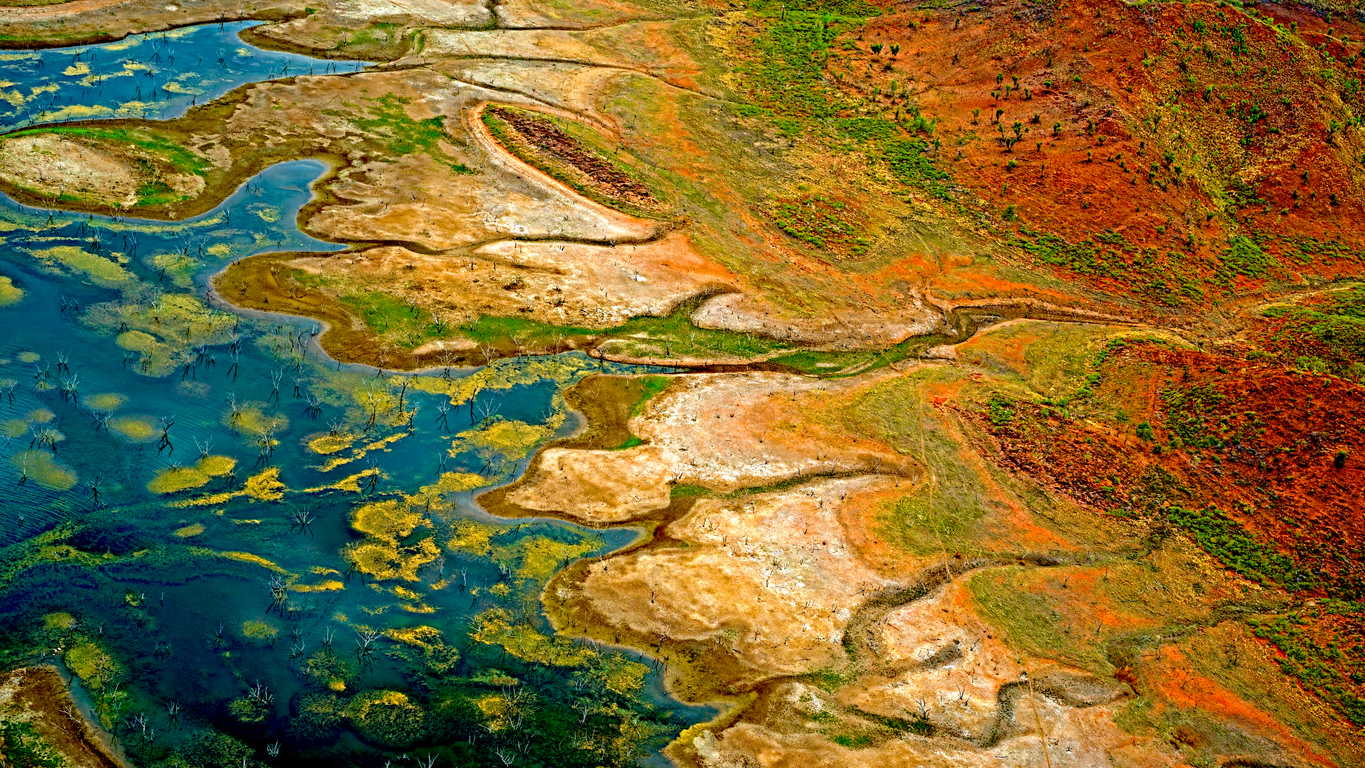
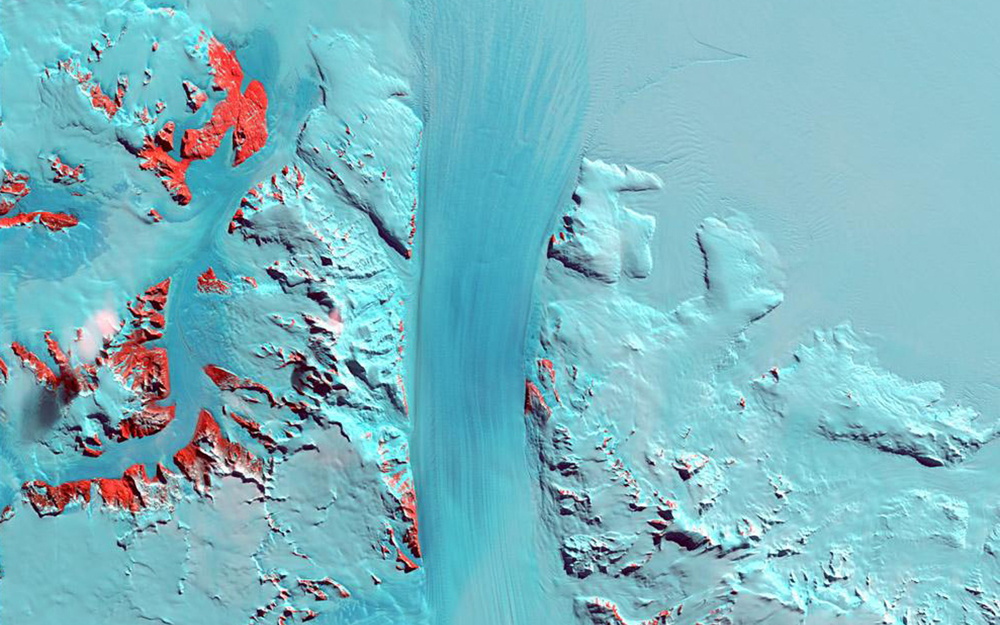
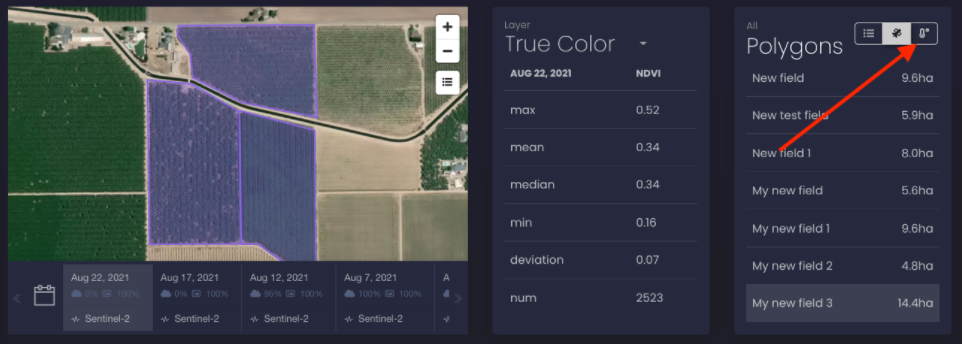
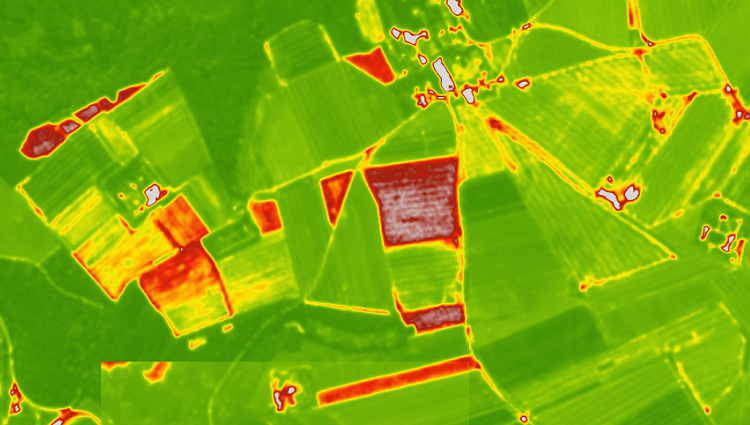
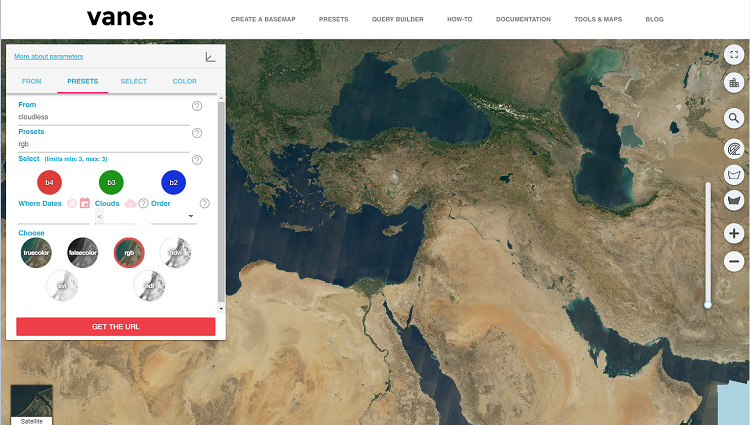
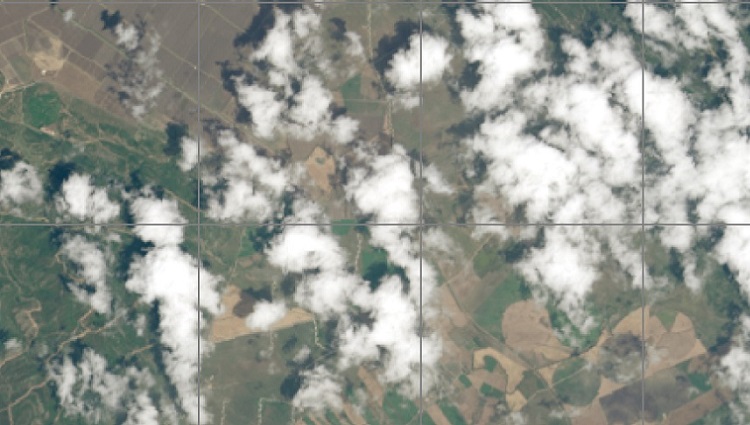
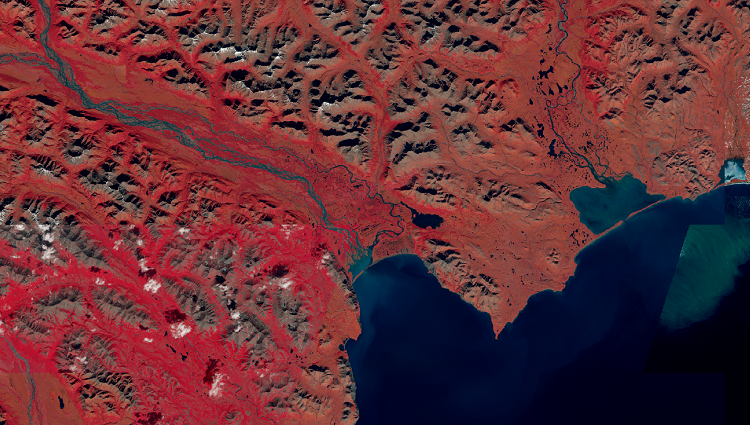
Satellite data: VANE platform
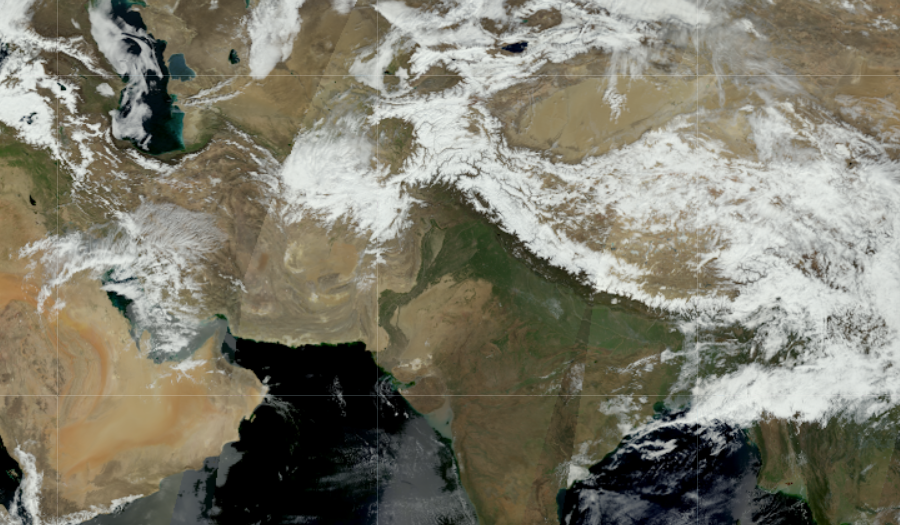
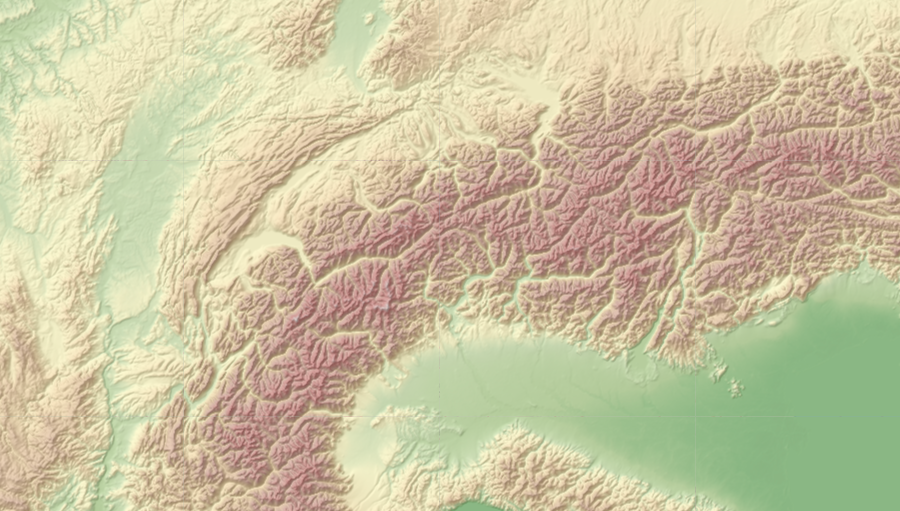
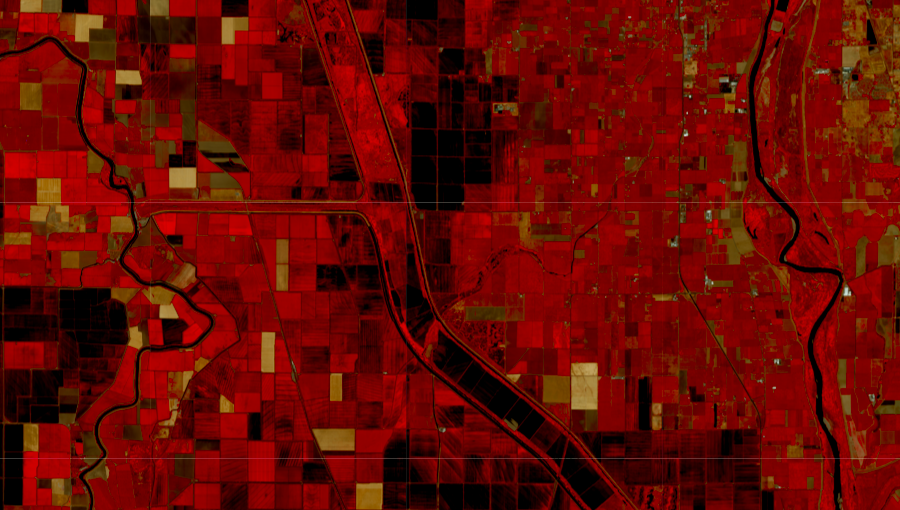
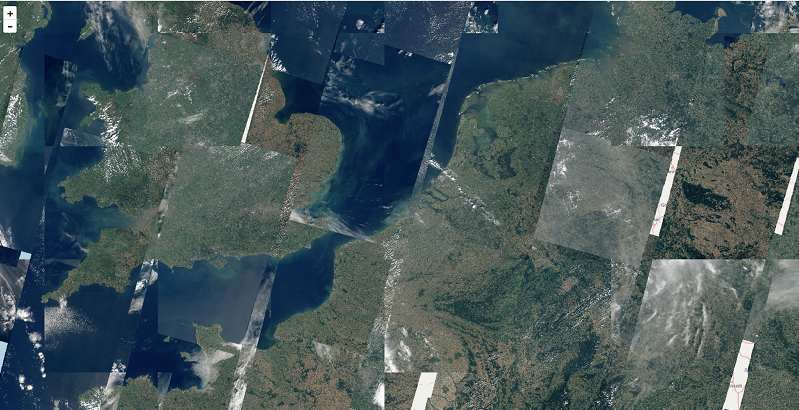
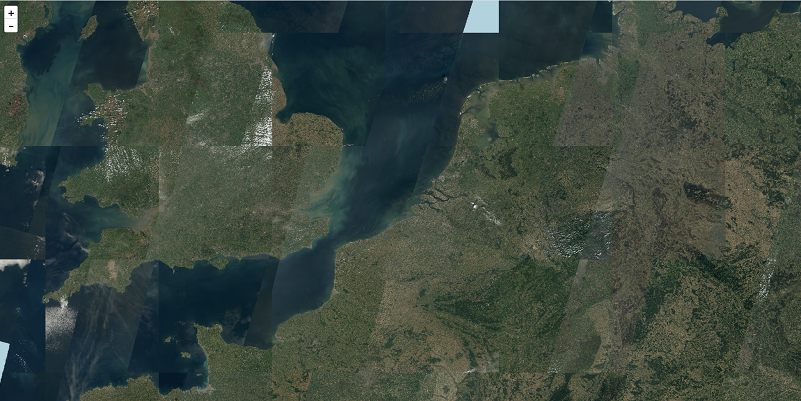
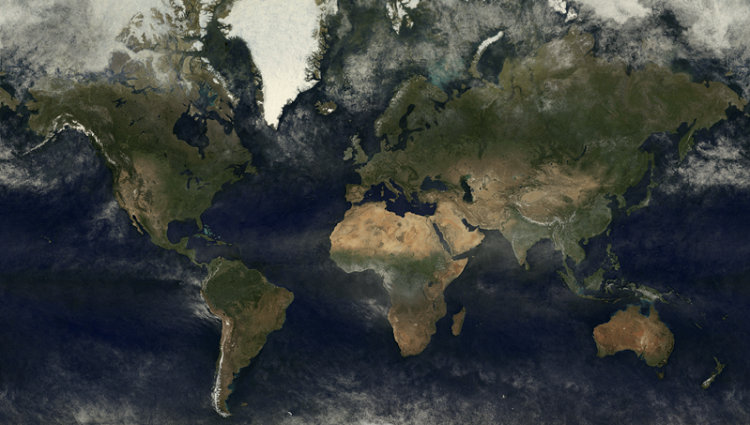
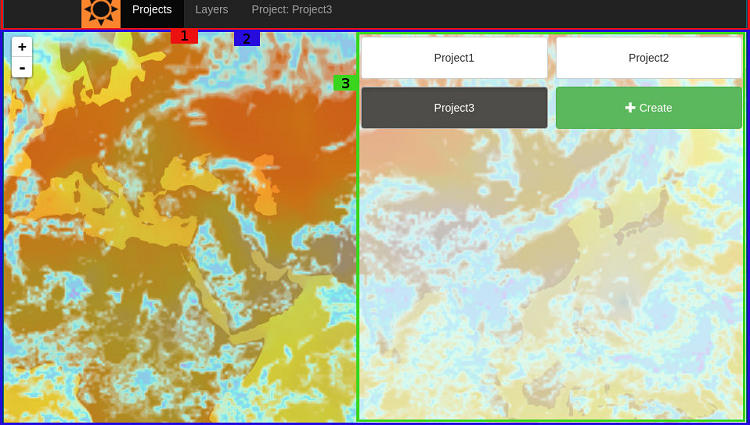
In 2017, we significantly improved our satellite platform. Our team undertook a huge amount of work and in June were able to present a new version of the satellite image processing platform VANE.
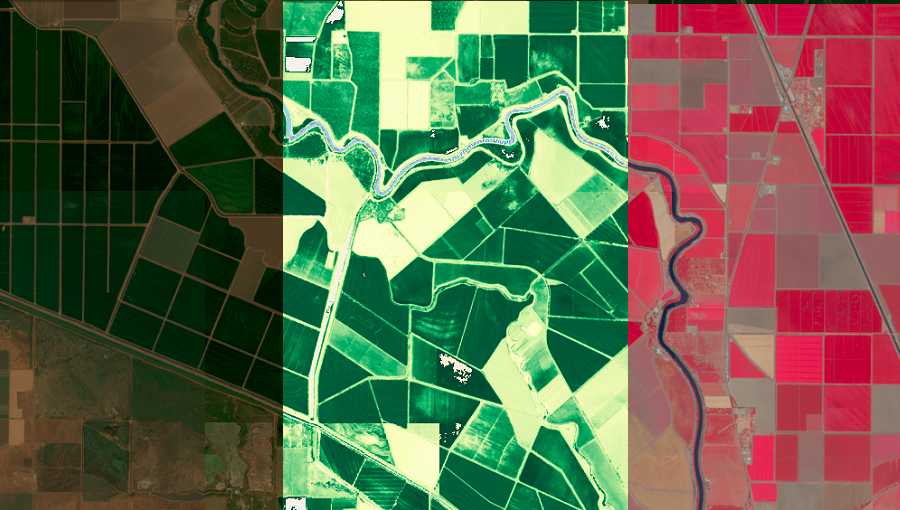
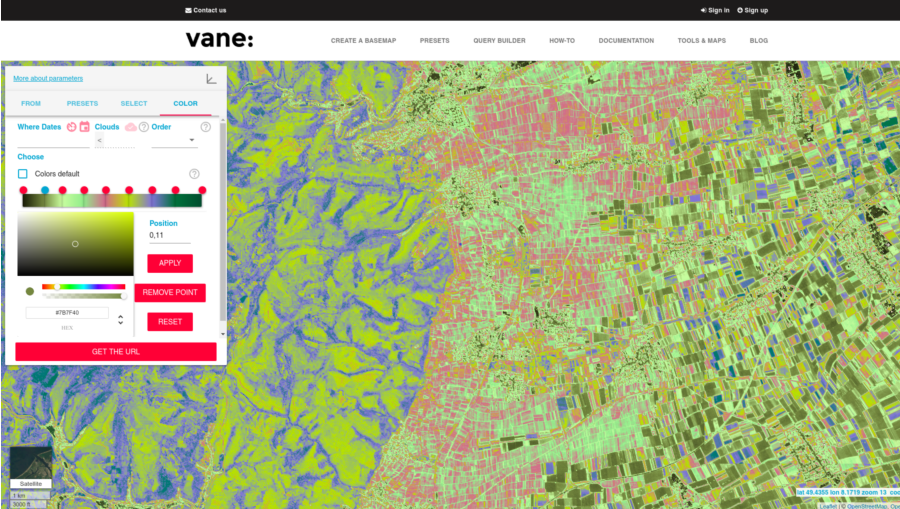
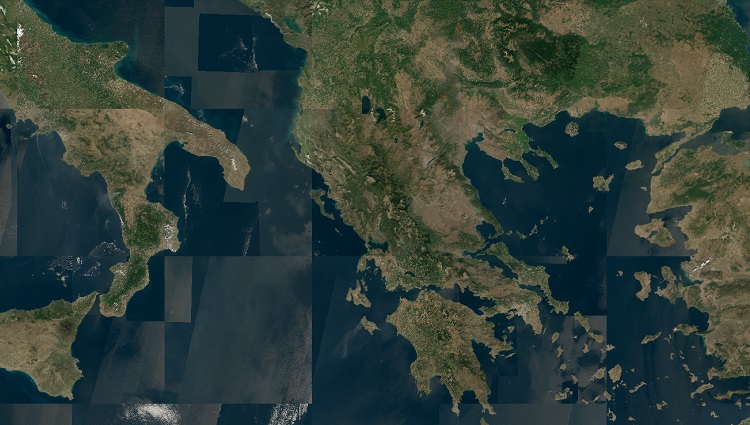
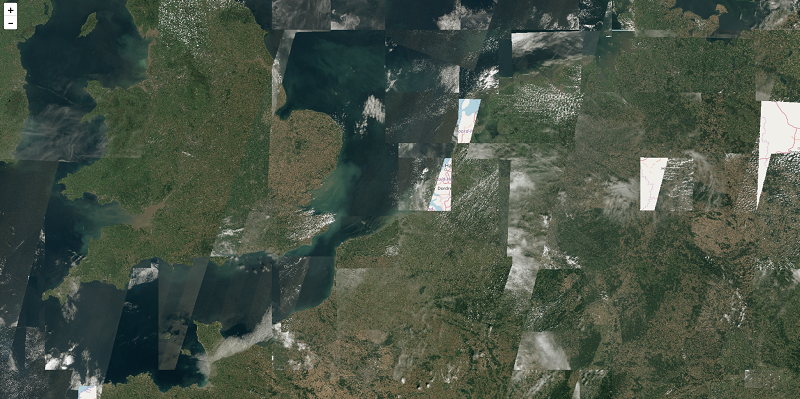
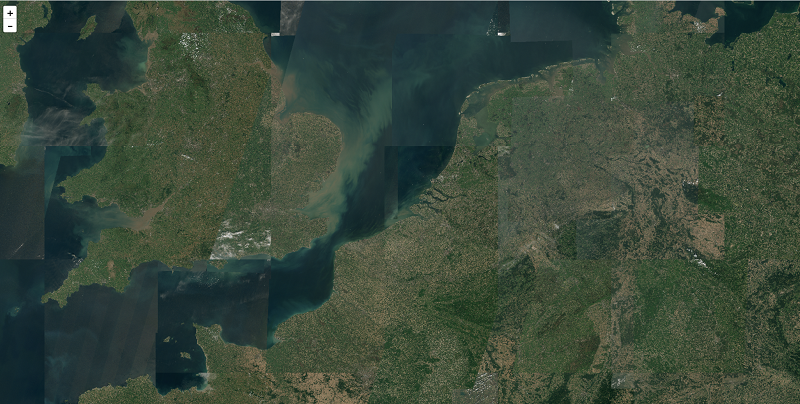
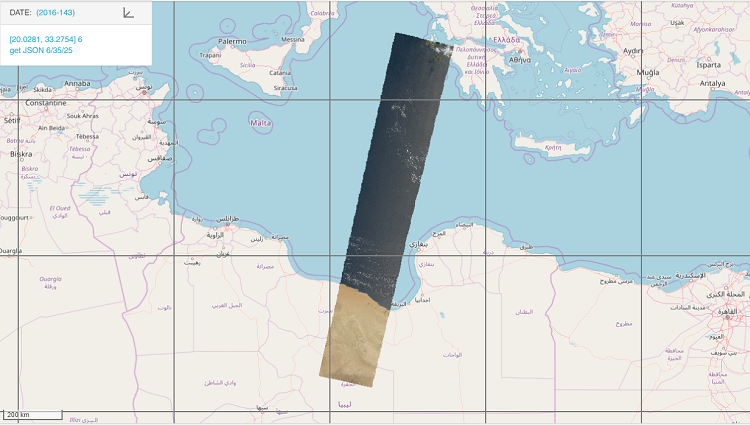
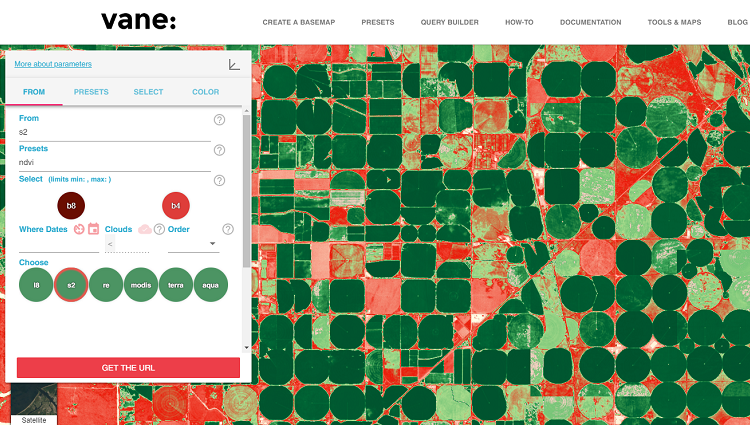
Based on the VANE platform, we developed a new product called Global Satellite Base Map, which uses visual tools and query language to generate a map from satellite images. The uniqueness of the product is that all data processing is done on the fly, and there are no presets or pre-made calculations. The user defines the parameters for a calculation and image processing and immediately receives a result for any territory. This capability was only possible thanks to VANE, our super-powerful data processing platform.
We recently presented you with Query Builder, our new interface for the VANE platform. Now you can use this simple tool to create your own map in just a few seconds, and with just one click receive a completed link for display on your site or app using a web map library like Leaflet, Open Layer, Mapbox and Google Maps.
We are grateful to everyone that worked with us for all this time. We thank you for all your feedback and for not getting bored by our tech support.
We have a ton of plans for the coming year. Stay tuned, and you will see a lot of the new and interesting things to come. Subscribe to our Telegram Channel https://t.me/openweathermap and get news first about our updates and new products!